STAT150 Lecture Notes - Lecture 10: Dependent And Independent Variables, Scatter Plot, Lincoln Near-Earth Asteroid Research

29 Jun 2018
School
Department
Course
Professor

STAT150 LECTURE – 16/5/18
WK10; SIMPLE LINEAR REGRESSION PART 2
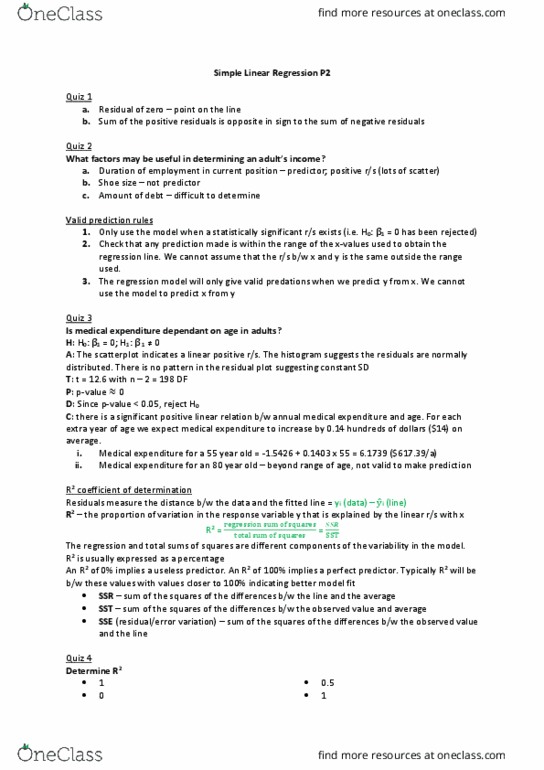
USING THE LEAST SQUARE REGRESSION LINE TO MAKE PREDICTIONS
Rules for Valid Predictions
1. Only use the model to make predictions when a
statistically significant relation exists (i.e. the
hypothesis has been rejected)
2. Check that any prediction made is within the range
of the x-values used to obtain the regression line.
We cannot assume that the relation between X and Y
is the same outside the range used (this is called
extrapolation)
3. The regression model will only give valid
predictions when we predict Y (the outcome) from X
(the determinant). We cannot use the model to
predict X from Y
find more resources at oneclass.com
find more resources at oneclass.com
: COEFFICIENT OF DETERMINATION
- In regression, finding a significant relationship is great but it would also be useful to
know how good our linear model is.
- Suppose we had the choice between two or more predictors, which one does a
better job as a predictor?
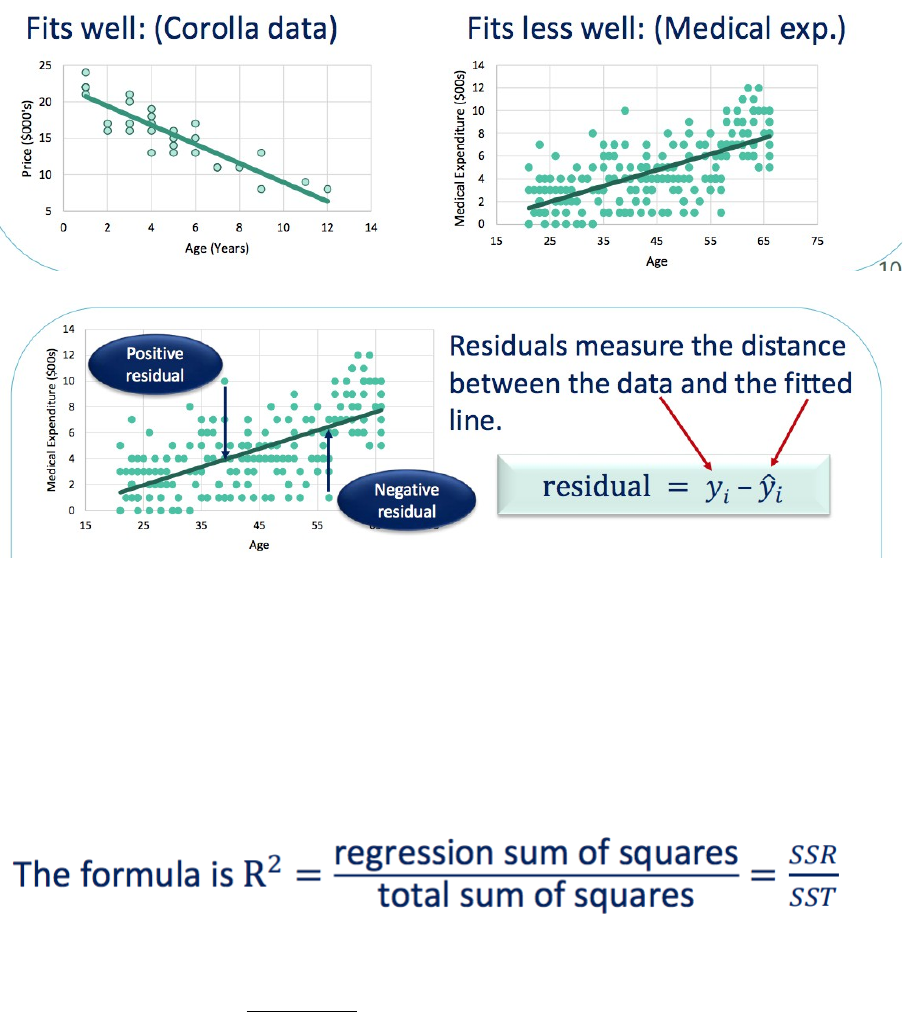
- What we need to determine is how well the linear regression line fits the data;
Residuals can be positive (for data points above the line) or negative (for points below the
line).
Since residuals measure the distance between the data and the fitted line, we base our
measure of how well the data fits the model (called goodness-of-fit) on the residuals and
the statistic. (or ) is known as the coefficient of determination.
is defined as the proportion of variation in the response variable, Y, that is explained by the
linear relationship with the predictor, X.
The regression and total sums of squares are different components of the variability in the
model.
is usually expressed as a percentage.
An of 0% implies a useless predictor (with none of the variability in Y explained by X). An of
100% implies a perfect predictor (which will almost never happen.) More typically will be
between these values with values closer to 100% indicating a better model fit.
find more resources at oneclass.com
find more resources at oneclass.com
Document Summary
Using the least square regression line to make predictions. We cannot assume that the relation between x is the same outside the range used (this is extrapolation: the regression model will only give valid predictions when we predict y (the outcome) (the determinant). We cannot use the model to predict x from y range line. and y called from x. In regression, finding a significant relationship is great but it would also be useful to know how good our linear model is. What we need to determine is how well the linear regression line fits the data; Residuals can be positive (for data points above the line) or negative (for points below the line). The regression and total sums of squares are different components of the variability in the model. is usually expressed as a percentage. An of 0% implies a useless predictor (with none of the variability in y explained by x).