STAT150 Lecture Notes - Lecture 10: Shoe Size, Dependent And Independent Variables, Scatter Plot

14 Aug 2018
School
Department
Course
Professor
Document Summary
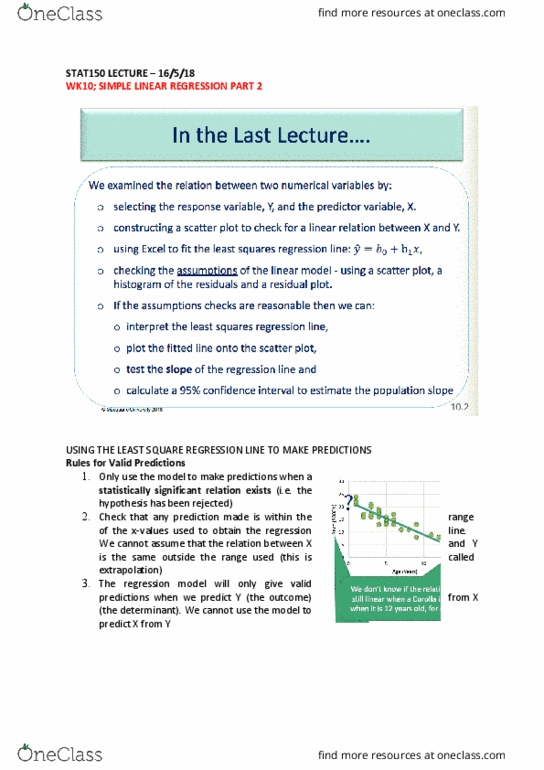
Quiz 1: residual of zero point on the line, sum of the positive residuals is opposite in sign to the sum of negative residuals. What fa(cid:272)tors (cid:373)ay (cid:271)e useful i(cid:374) deter(cid:373)i(cid:374)i(cid:374)g a(cid:374) adult"s i(cid:374)(cid:272)o(cid:373)e: duration of employment in current position predictor; positive r/s (lots of scatter, shoe size not predictor, amount of debt difficult to determine. We cannot assume that the r/s b/w x and y is the same outside the range used: the regression model will only give valid predations when we predict y from x. We cannot use the model to predict x from y. H: h0: 1 = 0; h1: 1 0. A: the scatterplot indicates a linear positive r/s. The histogram suggests the residuals are normally distributed. There is no pattern in the residual plot suggesting constant sd. T: t = 12. 6 with n 2 = 198 df. C: there is a significant positive linear relation b/w annual medical expenditure and age.