ECON10005 Lecture Notes - Lecture 2: Squared Deviations From The Mean, Central Tendency, Standard Deviation

27 Jul 2018
School
Department
Course
Professor
Document Summary
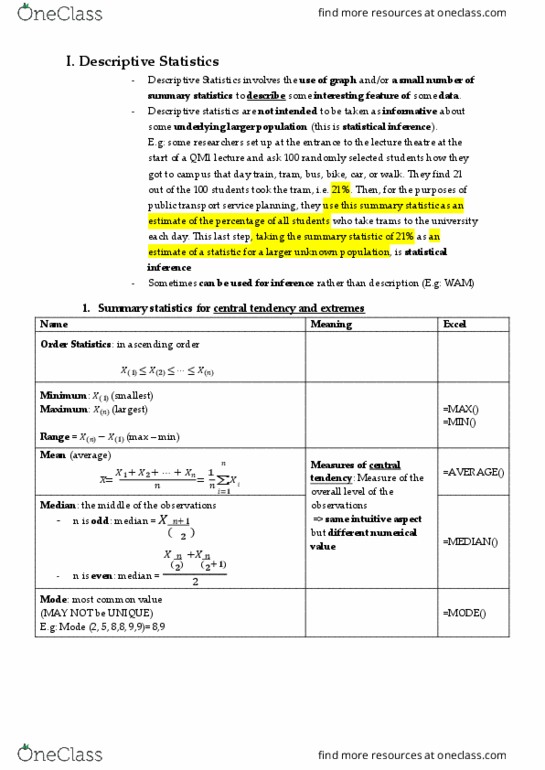
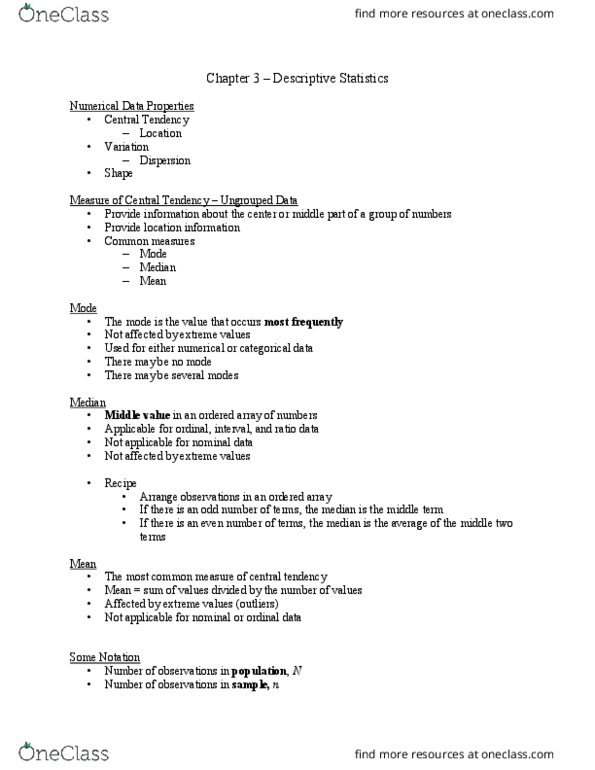
Numerical descriptors/measures allow us to connect the shapes, patterns and pictures that we see to numerical quantities. Tells use the numerical centre of our data. The value that partitions an ordered data set into two equal parts. Gives a sense of the relative centre of the data. Spread dispertion in terms of deviations from the mean. Mean absolute deviation computing the absolute deviaitons from the mean then calculating the average. Sample variance involves taking squared deviations (it"s the sum of squares) Sum the squared deviations from the mean, then divide by (n-1) degrees of freedom correction. The greater the value, the greater the spread/variability. More popular as it"s the sample analogue of the population variance which is used to describe probability distributions. Produced when the sample variance is rescaled back into the same units as the data. To rescale need to take the square root. 68% of data falls between 1 standard deviation of the mean.