ENGG2111 Lecture Notes - Lecture 2: Gantt Chart, Bar Chart, Critical Path Method

2 Sep 2018
School
Department
Course
Professor
Document Summary
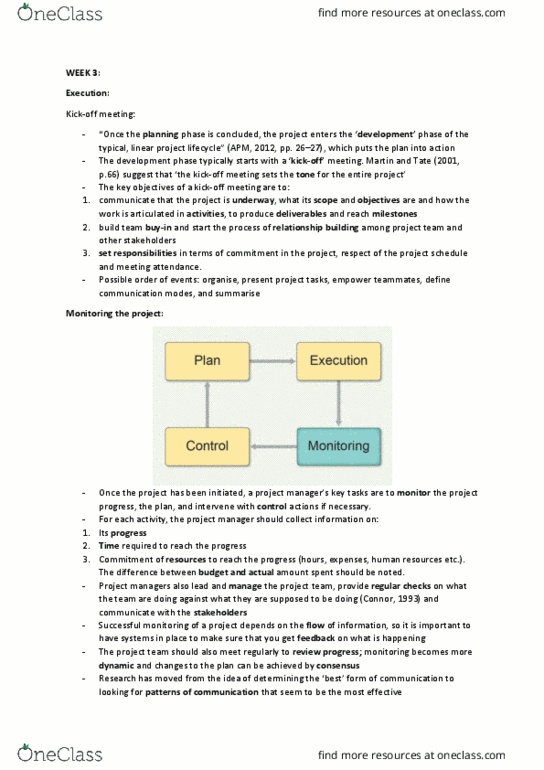
A gantt chart is often the tool a project manager uses to make a rough estimate of the time that it will take to complete the activities and the whole project. Gantt charts assist in defining the flow of events in planning the project. A gantt chart shows all the activities of a project and their duration as a bar chart, with the timescale at the top or bottom. Gantt charts can also indicate milestones and deliverables at key points on the chart. The column named predecessors indicates the immediate predecessors of each activity. A budget identifies the planned expenditure for a project. Initial cost estimates often start as an informed guess, which can then be refined and a greater understanding of scope, schedule and resources required is developed. The appropriate people with expertise are general the most desirable for each specific task, however it is rarely that straightforward.