ENVX1002 Lecture Notes - Lecture 10: Normal Distribution

24 Jul 2018
School
Department
Course
Professor
Document Summary
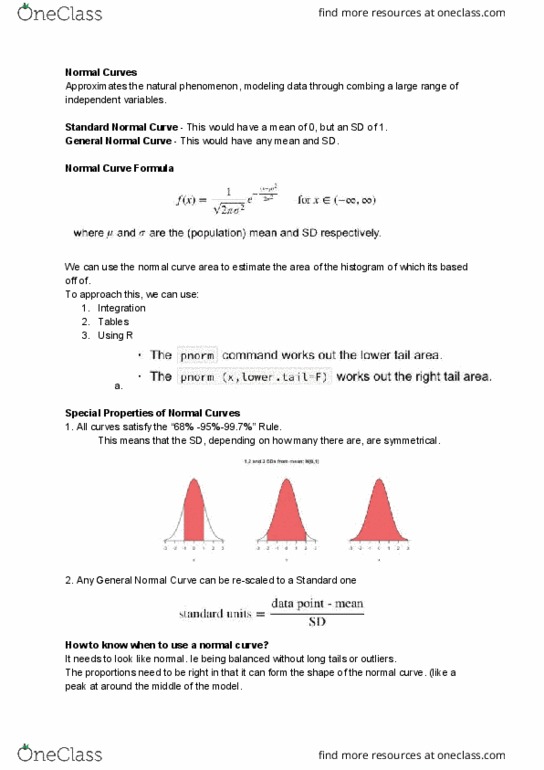
The normal curve approximates many natural phenomenon. Can model data caused by combining a large number of independent variables. The standard normal curve (z) has mean 0 and sd 1. The general normal curve (x) has any mean and sd. It turns out the normal curve has a simple formula. If the normal curve seems to fit the histogram, then we can use the area under the normal curve as an approximation to the area under the histogram. Special properties of the normal curve: all normal curves satisfy the 68% - 95% - 99. 7% rule. The area 1 sd out from the mean in both directions is 0. 68. The area 2 sd out from the mean in both directions is 0. 95. The area 3 sd out from the mean in both directions is 0. 997: any general normal can be rescaled into the standard normal.