MATH1005 Lecture Notes - Lecture 4: Normal Distribution, Standard Deviation

25 Oct 2018
School
Department
Course
Professor
Document Summary
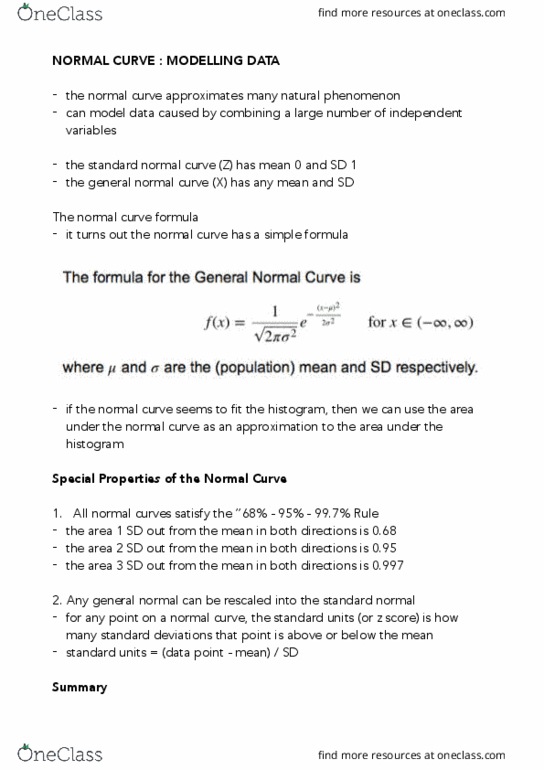
Approximates the natural phenomenon, modeling data through combing a large range of independent variables. This would have a mean of 0, but an sd of 1. We can use the normal curve area to estimate the area of the histogram of which its based off of. Special properties of normal curves: all curves satisfy the 68% -95%-99. 7% rule. This means that the sd, depending on how many there are, are symmetrical: any general normal curve can be re-scaled to a standard one. Ie being balanced without long tails or outliers. The proportions need to be right in that it can form the shape of the normal curve. (like a peak at around the middle of the model. Individual measurement = exact value + chance error. The best way to estimate this error is to replicate the measurement under the same conditions, with calculating the standard deviation.