PSYC1001 Lecture Notes - Lecture 17: Null Hypothesis, Statistical Inference, Descriptive Statistics

2 Jul 2018
School
Department
Course
Professor

17/04/2018 Predictions and Descriptive Statistics
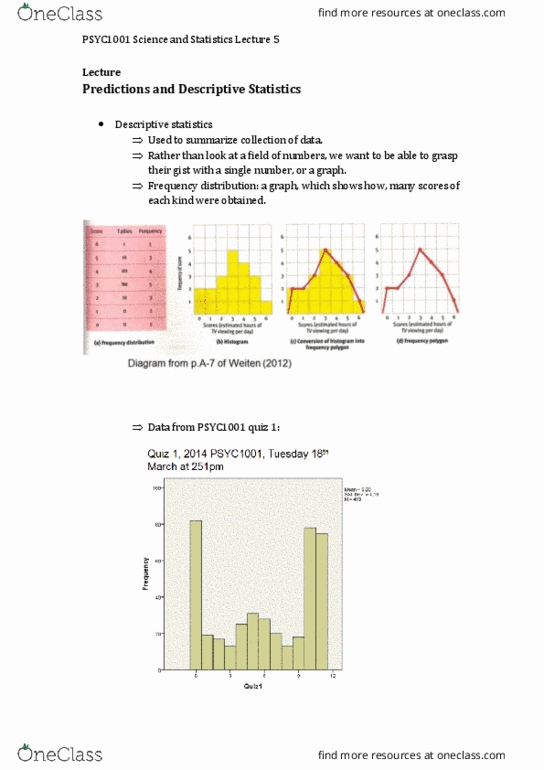
Descriptive statistics are used to summarise a collection of data – rather than look at a field
of numbers, we want to be able to grasp their gist with a single number, or a graph
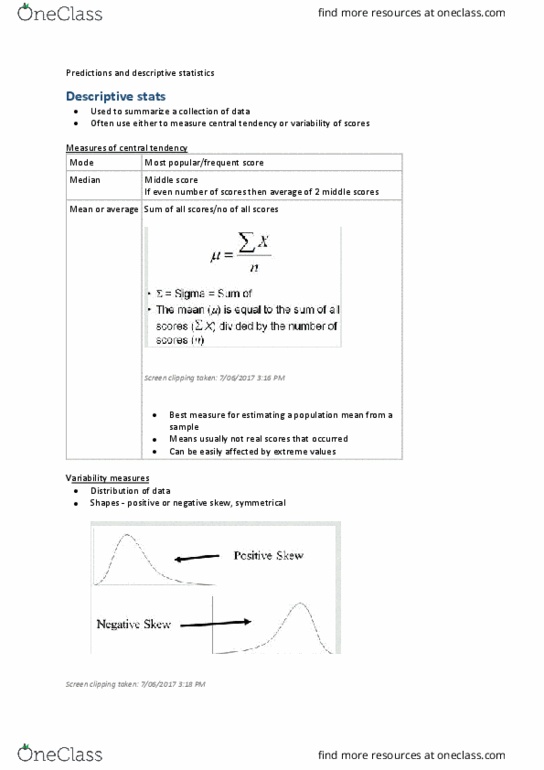
The descriptive statistics we most often use either measure the central tendency or
variability of scores
The mode = most common score, the most frequent score
The median = middle score, or the average of the 2 middle scores
The mean = the average of the scores
Experimental hypothesis – a specific prediction to be tested – prediction of what will happen
in your study – should be derived either from the previous literature and findings, or from a
theory which allows for specific predictions to be made
Hypothesis is an educated guess - justified
Confirmation bias – where you design your study and evidence collection technique to
confirm what you think – you need to consider if you are wrong, what will it look like?
Cognitive dissonance – when you are doing something but not being appropriately rewarded
for it – you have to motivate yourself to do it if you aren’t really rewarded for it
Have to convince yourself that you like what you suffer for
The null hypothesis – hypothesis of no effect – nothing is going on – what results would look
like if nothing is going on – a construct we use in inferential statistics to help us overcome all
our natural tendencies to avoid testing what we currently believe – it is a statement of what
would be the case if nothing is happening, if the theory is wrong, if there is no effect, if there
is no difference between groups, etc.
Disprove reject null, don’t disprove retain null
Absence of evidence is not evidence of absence (don’t disprove)
Descriptive statistics:
Raw scores
Distributions (imagining how numbers are shaped, way we shape the data) – frequency
polygon
Frequency Distribution – most helpful in psychology
Mean is the most popular to use – it’s the best for predicting population means from sample
means
Positive skew is frequency distribution graph veering to the left, whereas negative veers to
the right
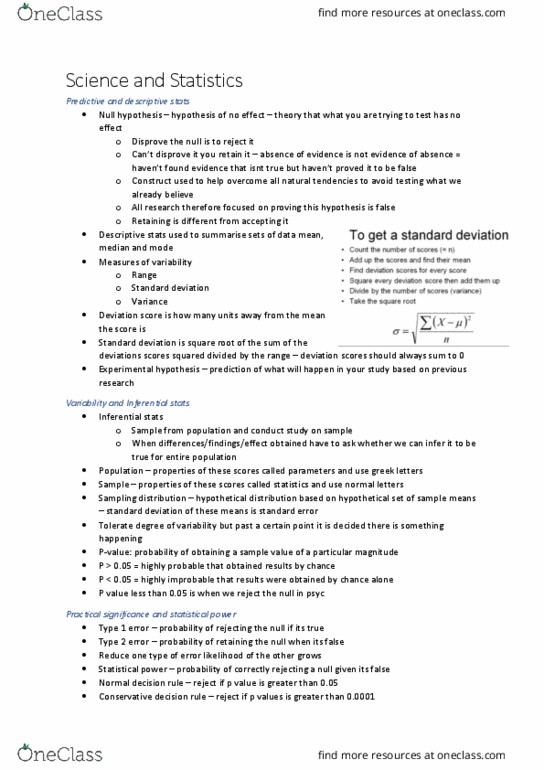
To get standard deviation
1. Count the number of scores (n)
2. Add up the scores and find their mean
3. Find deviation scores for every score
4. Square every deviation score then add them up
5. Divide by the number of scores (variance)
6. Take the square root
find more resources at oneclass.com
find more resources at oneclass.com
Document Summary
Descriptive statistics are used to summarise a collection of data rather than look at a field of numbers, we want to be able to grasp their gist with a single number, or a graph. The descriptive statistics we most often use either measure the central tendency or variability of scores. The mode = most common score, the most frequent score. The median = middle score, or the average of the 2 middle scores. The mean = the average of the scores. Hypothesis is an educated guess - justified. Cognitive dissonance when you are doing something but not being appropriately rewarded for it you have to motivate yourself to do it if you aren"t really rewarded for it. Have to convince yourself that you like what you suffer for. Disprove reject null, don"t disprove retain null. Absence of evidence is not evidence of absence (don"t disprove) Distributions (imagining how numbers are shaped, way we shape the data) frequency polygon.