PSYC1001 Lecture Notes - Lecture 4: Negative Number, Central Tendency, Descriptive Statistics

9 Aug 2018
School
Department
Course
Professor
Document Summary
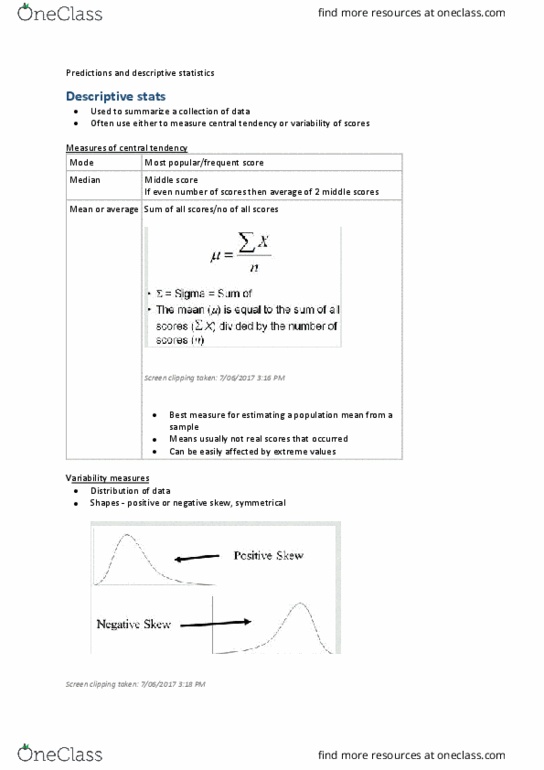
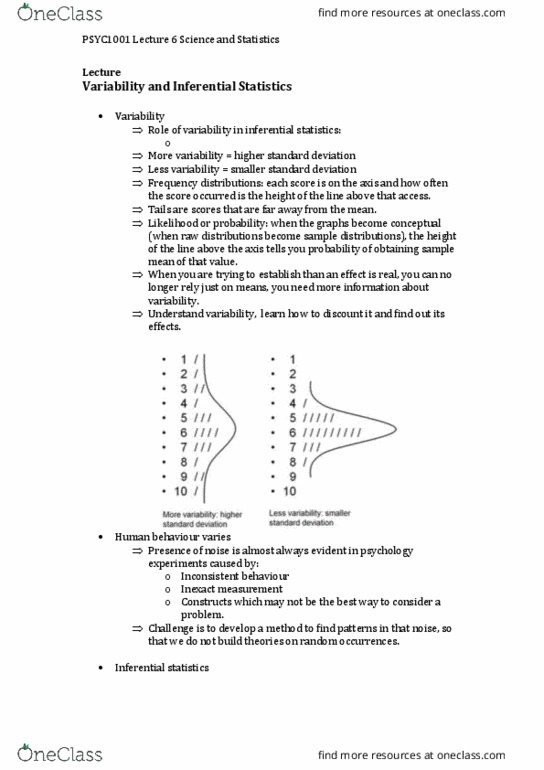
Rather than look at a field of numbers, we want to be able to grasp their gist with a single number, or a graph. Frequency distribution: a graph, which shows how, many scores of each kind were obtained. Psyc1001 science and statistics lecture 5: measures of central tendency. Descriptive statistics we most often use measure either central tendency or variability of scores. Measures of central tendency include: mode: Advantage: they are real scores that actually occur. Mean of 2. 4 children doesn"t make sense but a mode of 4 children is a real score. Disadvantage: depend on how you group the data. E. g. if all cancers are grouped together cancer is the most common way to die, but if separate cancers are considered road fatalities have a higher rank: median: Rank scores in order and count to halfway point. Location of median: n+1/2 where n is the no. of scores.