MARK3054 Lecture Notes - Lecture 2: Multicollinearity, Dependent And Independent Variables, Analysis Of Variance

Topic 2: Customer Preference Elicitation
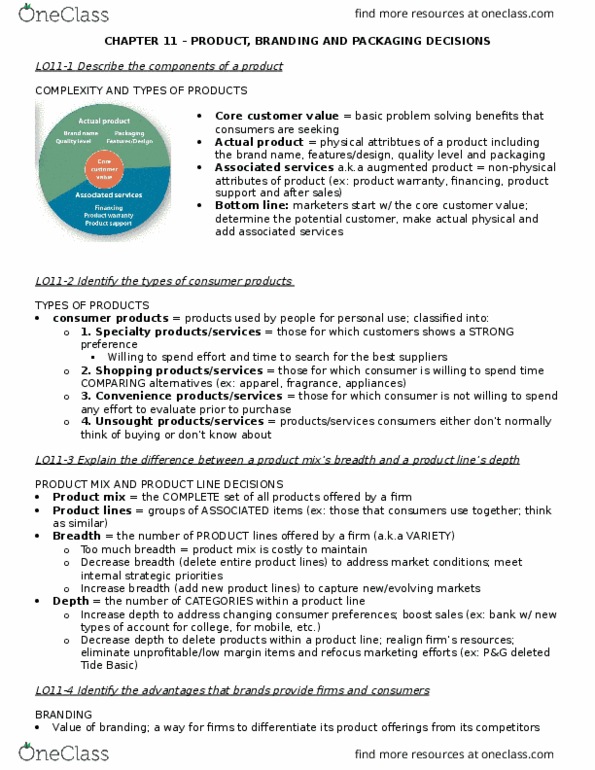
• Understand customer needs and how these translate into value they want in
potential offerings.
• Focus on customer value assessment and customer valuation methods
• Through objective measures (for functional and economic needs), perceptual
measures (for perceived and psychological needs) and behavioural measures (for
purchase process).
• Difference between COGS and price is the margin. Difference between price and
customer value is value distributed. Margin + value distributed = value created
Lecture Example: Vittoria Coffee
1. How much do customers value different package size regarding coffee beans?
2. How much do consumers value our brand when buying coffee beans?
Using regression, we can use variables to predict other variables. The regression line is
where the sum of squared errors is minimised.
General regression line equation: y=b0 + b1*x+ e (error)
When solving a problem,
1. Reword the question to find the insight needed:
a. How much more are customers willing to pay for a larger package?
b. How much more are customers willing to pay for Vittoria vs. another brand?
2. Write out the equation:
a. WTP= b0 + b1 * weight
b. WTP = b0 + b1*vittoria vs. other
3. Interpreting data output:
Significance of regression= Determine if the regression is significant through the ANOVA
test p-value < 0.05
Model fit = Determine model fit using r2, or adjusted r2 only to compare different models
Variable coefficient effect size and significance = What are the coefficients and are there
individual p values < 0.05?
4. Answer the original question:
Plug the new numbers into the equation, and answer the question.
Issues:
1. In this case, a better approach would be to just use a multiple linear regression and
include both brand and weight into the regression i.e. WTP = b0 + b1* weight + b2 *
brand. This is so that the regression becomes a better predictor of the WTP (as the r2
for the WTP and brand regression is very low)
a. IMPORTANT: An assumption in multiple linear regression is that the
independent variables are uncorrelated (i.e. no multicollinearity). Thus, check
correlation before regressing. After regression, if VIF<10, or correlation
coefficient is between -0.7 and 0.7 then collinearity is acceptable.
find more resources at oneclass.com
find more resources at oneclass.com
Document Summary
Difference between price and customer value is value distributed. Using regression, we can use variables to predict other variables. The regression line is where the sum of squared errors is minimised. General regression line equation: y=b0 + b1*x+ e (error) Significance of regression= determine if the regression is significant through the anova test p-value < 0. 05. Model fit = determine model fit using r2, or adjusted r2 only to compare different models. Variable coefficient effect size and significance = what are the coefficients and are there individual p values < 0. 05: answer the original question: Plug the new numbers into the equation, and answer the question. Issues: in this case, a better approach would be to just use a multiple linear regression and include both brand and weight into the regression i. e. wtp = b0 + b1* weight + b2 * brand.