MATH 1F92 Lecture Notes - Lecture 8: Scatter Plot, Dependent And Independent Variables, Standard Deviation

1 Oct 2016
School
Department
Course
Professor
Document Summary
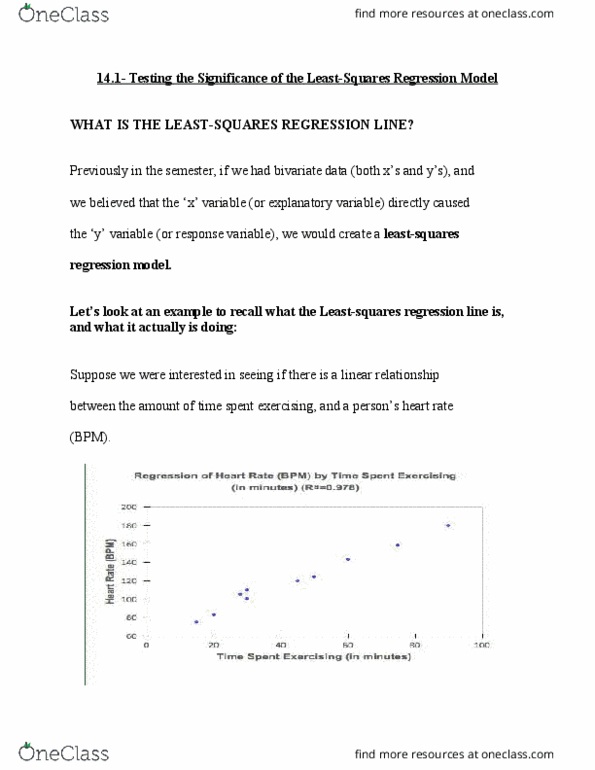
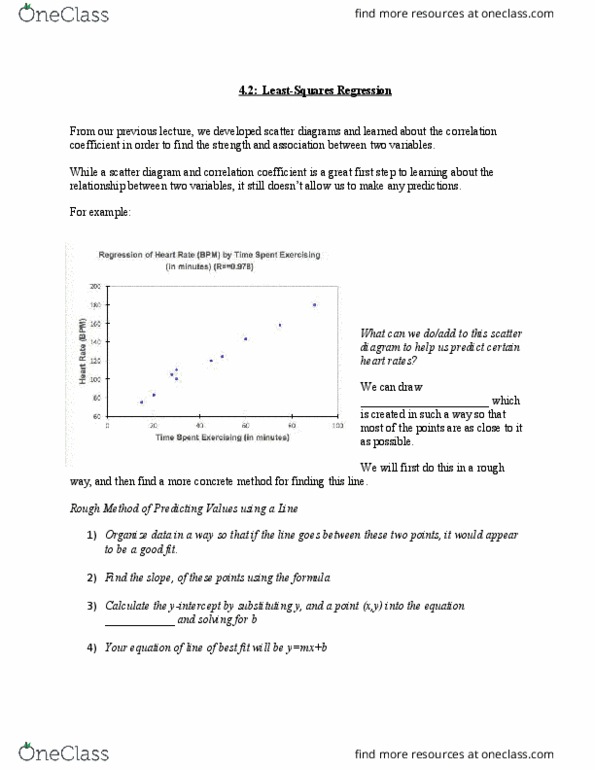
We are used to univariable data where we are only concerned with 1 variable. But when we start looking at how one variable affects another, we are interested in bivariable data, where we are concerned with 2 variables Explanatory variable: an independent variable that is said to explain the response variable. Response variable: a dependent variable that is said to have been caused by the explanatory variable. To try and see the type of relationships that an explanatory variable and a response variable have in bivariate data, we produce diagrams called scatter diagrams. A graph that shows the relationship between two quantitative variables measured on the same individual. Each individual represents one point on the scatter diagram with the explanatory on the x-axis and the response on the y-axis. Example 1: plot a scatter diagram for the following data points: 92: can we see any relationship emerging from the number of hours studied and the mark on final exam? i)