MATH 1F92 Lecture 10: Math+1F92-+7.2a-+Finding+Probabilities+using+Z-Tables+Fill+In

16 Feb 2017
School
Department
Course
Professor
Document Summary
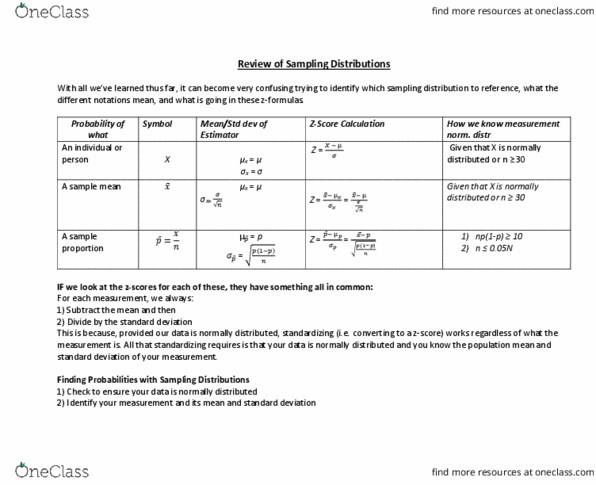
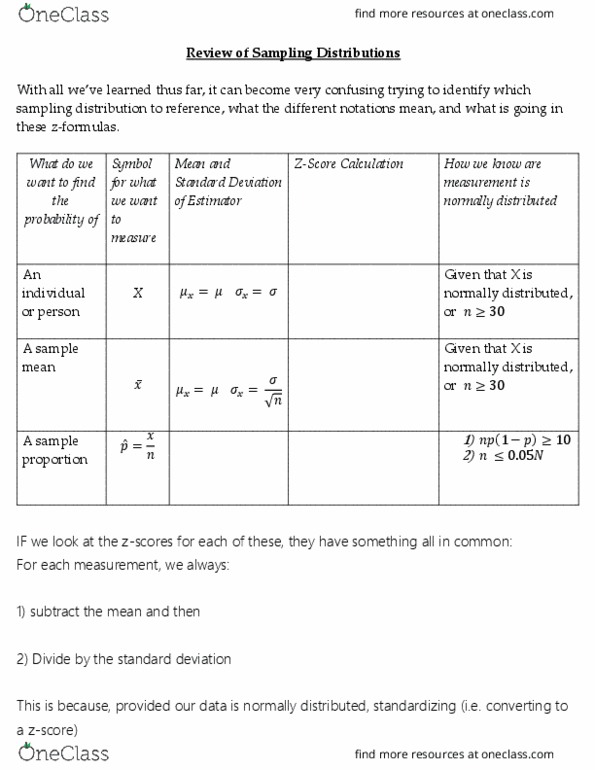
If we have a random variable that we think may have a normal distribution (or is approximately normally distributed), the area underneath the normal curve represents the proportion of the population that has the certain characteristic. While the empirical rule allows us to find some of the proportions and probabilities of intervals of our raw scores, it won"t allow to find probabilities for any specific interval we want! Suppose that the random variable x is normally distributed with mean and standard deviation . Then the random variable: is normally distributed with mean =(cid:882) and =(cid:883). The random variable z is said to have the standard normal distribution. By standardizing a normal variable, we allow us to put it in terms of how many standard deviations it is away from the mean. When a set of data that is normally distributed has a mean different than.