MATH 1F92 Lecture 9: Math+1F92-+7.1b-+Introduction+to+the+Normal+Distribution+Fill+In

16 Feb 2017
School
Department
Course
Professor
Document Summary
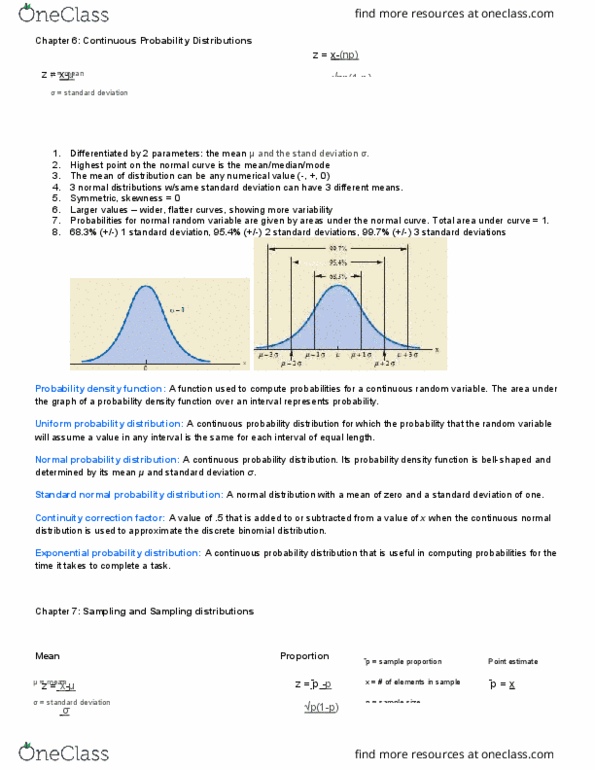
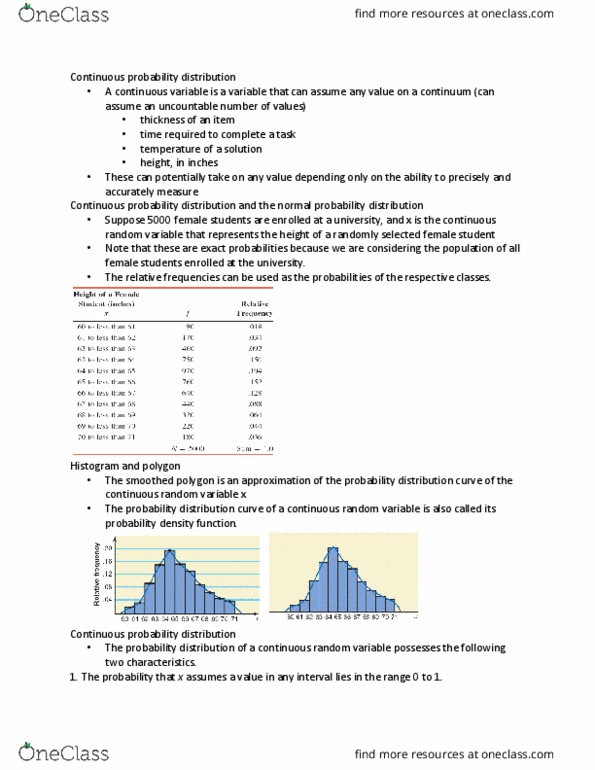
In the previous lecture, we looked at the uniform distribution, which was a probability density function for having an equal probability for any interval being selected. However, not all continuous random variables have the same probabilities for an interval being selected. Imagine the distribution of marks for math 1f92: This brings us to most common continuous distribution: the normal. A continuous random variable is normally distributed, or has a normal probability distribution, if its relative frequency histogram has the shape of a normal curve. Let"s imagine a scenario of final marks in a classroom: Histogram of 100 students marks y c n e u q e r f e v i t a l e. 0. 05 y c n e u q e r f e v i t a l e. 0. 15 y c n e u q e r f e v i t a l e.