ACCO 240 Lecture Notes - Corporate Finance, Reserve Requirement, Inventory Turnover

Document Summary
Get access


Related Documents
Related Questions

SEC 10K: Income Statement - COSTCO
Locate the income statement in your companyâs most recent 10-K,and respond to the following questions. Sometimes the incomestatement is called Consolidated Statements of Earnings,Consolidated Statements of Operations, or somethingsimilar.
http://phx.corporate-ir.net/phoenix.zhtml?c=83830&p=irol-SECText&TEXT=aHR0cDovL2FwaS50ZW5rd2l6YXJkLmNvbS9maWxpbmcueG1sP2lwYWdlPTEwNTI0MTM0JkRTRVE9MCZTRVE9MCZTUURFU0M9U0VDVElPTl9FTlRJUkUmc3Vic2lkPTU3#sD5DA86177F33EC84CEA9D3EF14FC1730
By the way, you should ignore the Statement of ComprehensiveIncome because that's a financial statement covered in moreadvanced accounting classes. We won't be doing anything with thatstatement in our introductory accounting class.
Category: Revenue and Net Income
Identify the following amounts for the two most recentyears:
Net Sales (or Total Sales if your company has more than onesource of revenue) Some companies use the term Revenue instead ofSales.
Cost of Goods Sold (aka Cost of Products, Cost of Sales, Cost ofServices, etc.)
Gross Profit (aka Gross Margin)
Category: Analysis
Calculate the following ratios (show and label yourcalculations) for the two most recent years and comment on theresults of your ratio analysis.
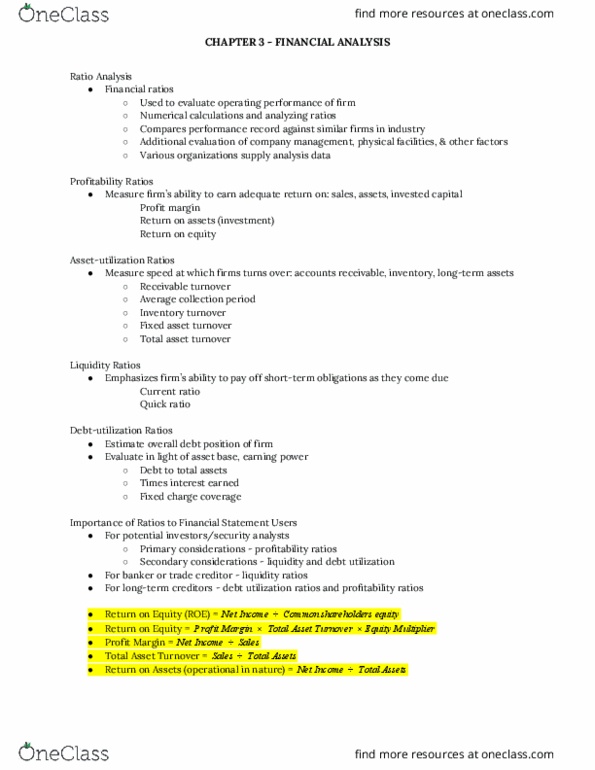
Gross profit margin = Gross profit ÷ Net sales à 100
Net profit margin = Net income ÷ Net sales à 100
Example: Johnson & Johnson (J&J)
Use this example as a guide for answering these discussionquestions for your company. For this example, please refer to theJ&J's Consolidated Statements of Earnings on page 21of its 2014 10-K.
| 2014 | 2013 | Calculation | ||
|---|---|---|---|---|
| Sales to customers | $74,331 | $71,312 | amount given in 10-K | |
| Cost of products sold | 22,746 | 22,342 | amount given in 10-K | |
| Gross profit | $51,585 | $48,970 | Sales â Cost of products sold |
And here are J&Jâs ratios:
| 2014 | 2014 Calculation | 2013 | 2013 Calculation | |
|---|---|---|---|---|
| Gross profit margin | 69.4% | 51,585 ÷ 74,331 à 100 | 68.7% | 48,970 ÷ 71,312 à 100 |
| Profit margin | 22.0% | 16,323 ÷ 74,331 à 100 | 19.4% | 13,831 ÷ 71,312 à 100 |

| P14-3 Performratio analysis and evaluate financial position and operatingresults | |||||||||
| Condensed balance sheet andincome statement data for Landwehr Corporation appear | |||||||||
| below and on page 644. | |||||||||
| LANDWEHR CORPORATION | |||||||||
| Balance Sheets | |||||||||
| December 31 | |||||||||
| 2018 | 2017 | 2016 | |||||||
| Cash | 25,000 | 20,000 | 18,000 | ||||||
| Accounts receivable (net) | 50,000 | 45,000 | 48,000 | ||||||
| Other current assets | 90,000 | 95,000 | 64,000 | ||||||
| Investments | 75,000 | 70,000 | 45,000 | ||||||
| Plant and equipment (net) | 400,000 | 370,000 | 358,000 | ||||||
| 640,000 | 600,000 | 533,000 | |||||||
| Current liabilities | 75,000 | 80,000 | 70,000 | ||||||
| Long-term debt | 80,000 | 85,000 | 50,000 | ||||||
| Common stock, $10 par | 340,000 | 310,000 | 300,000 | ||||||
| Retained earnings | 145,000 | 125,000 | 113,000 | ||||||
| 640,000 | 600,000 | 533,000 | |||||||
| LANDWEHR CORPORATION | |||||||||
| Income Statement | |||||||||
| For the Years Ended December 31 | |||||||||
| 2018 | 2017 | ||||||||
| Sales revenue | $740,000 | $700,000 | |||||||
| Less: Sales returns and allowances | 40,000 | 50,000 | |||||||
| Net sales | 700,000 | 650,000 | |||||||
| Cost of goods sold | 420,000 | 400,000 | |||||||
| Gross profit | 280,000 | 250,000 | |||||||
| Operating expenses (including income taxes) | 235,000 | 220,000 | |||||||
| Net income | $45,000 | $30,000 | |||||||
| Additional information: | |||||||||
| 1. The market price of Landwehr's common stock was$4.00, $5.00, and $8.00 for | |||||||||
| 2016, 2017 and 2018,respectively. | |||||||||
| 2. All dividends are paid in cash. | |||||||||
| Instructions | |||||||||
| (a) | Compute the following ratios for 2017 and2018. | ||||||||
| (1) Profit margin. | |||||||||
| (2) Asset turnover. | |||||||||
| (3) Earnings per share (Weighted-average commonshares in 2018 were 32,000 and | |||||||||
| in 2017 were31,000.) | |||||||||
| (4) Price-earnings ratio. | |||||||||
| (5) Payout ratio. | |||||||||
| (6) Debt to assets ratio. | |||||||||
| (b) | Based on the ratios calculated, discuss briefly theimprovement or lack thereof in | ||||||||
| financial position and operating results from 2017to 2018 of Landwehr Corporation. | |||||||||
| NOTE: Enter a number in cellsrequesting a value; enter either a number or a formula in cellswith a "?" . | |||||||||
| 2017 | 2018 | |||||||||
| (a) | Profit margin: | Profit margin: | ||||||||
| Net income | Value | Net income | Value | |||||||
| Net sales | Value | Net sales | Value | |||||||
| Asset turnover: | Asset turnover: | |||||||||
| Net sales | Value | Net sales | Value | |||||||
| Average total assets | Value | Average total assets | Value | |||||||
| Earnings per share: | Earnings per share: | |||||||||
| Net income - Pfd. Dividends | Value | Net income - Pfd. Dividends | Value | |||||||
| Weighted average common shares outstanding | Value | Weighted average common shares outstanding | Value | |||||||
| Price-earnings ratio: | Price-earnings ratio: | |||||||||
| Market price per share | Value | Market price per share | Value | |||||||
| Earnings per share | Value | Earnings per share | Value | |||||||
| Payout ratio: | Payout ratio: | |||||||||
| Cash dividends declared on common | Value | Cash dividends declared on common | Value | |||||||
| Net income | Value | Net income | Value | |||||||
| Debt to assets ratio: | Debt to assets ratio: | |||||||||
| Total liabilities | Value | Total liabilities | Value | |||||||
| Total assets | Value | Total assets | Value | |||||||
| (b) | Based on the ratios calculated, discuss briefly theimprovement or lack thereof in financial position and operatingresults | |||||||||
| from 2017 to 2018 of Landwehr Corporation. | ||||||||||
