FINA 200 Lecture Notes - Lecture 12: List Of Fables Characters

Get access


Related Documents
Related Questions

Can someone help with this case please, and:
Fill in all the blanks spaces in the spreadsheet for the 2017 column and the 2017 %rev column
Balance the B/S
Answer all questions in full sentence format
Please put in the correct number for forecasted PP&E based on narrative (I highlighted the phrase in the narrative)
Show work for how you calculated the forecasted interest for 2017.
Thank you so much for all your help.
Q.
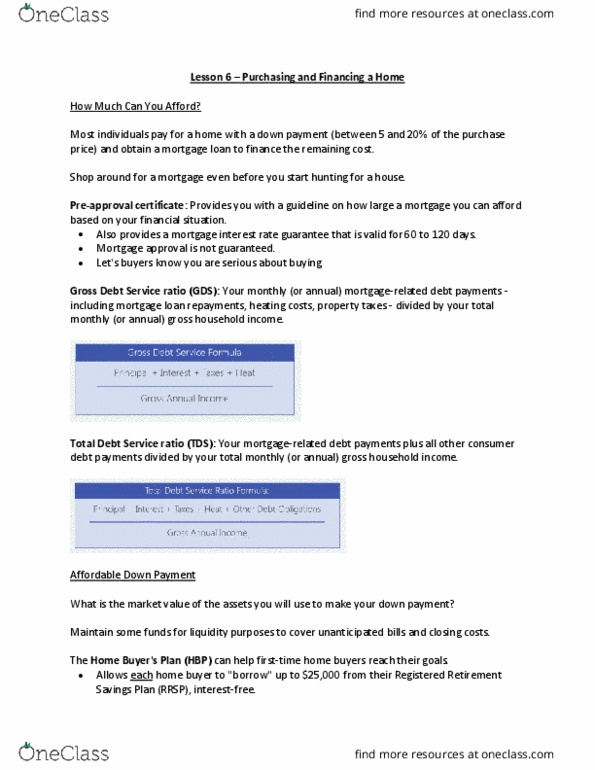
After the financial analysis based on 2016 preliminary estimates was completed, a number of changes were adopted to improve financial and business results for S&S Air during 2016. The customer that awarded the large 40 aircraft order agreed to make interim payments as finished aircraft were delivered (for a price concession). Revenue was revised up slightly due to updated marketing plans. Expenses were trimmed and controls were established that greatly reduced on hand inventory needs. A portion of the line of credit was converted to a 5 year, fixed rate loan. Cash on hand and general liquidity was forecasted to improve to acceptable levels by the end of the year.
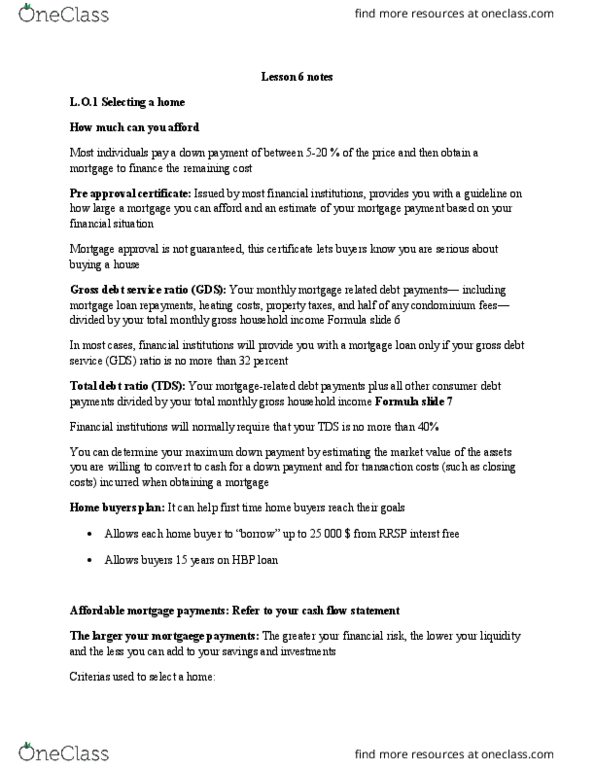
Mark and Marie approached Chris about creating a forecast for 2017. They had learned the value of the financial analysis done for 2016 and wanted to get a look at any issues or problems that might be looming in the future. Of particular concern was the continuing need for external funds as the firm continued to grow. The general consensus of Mark and Marie was that S&S Air should realize an increase in revenue of 17% in 2017 from the 2016 results, based on anticipated demand of aircraft. It was felt expenses would change by the same percent of sales as incurred in 2016. However, it was estimated that annual depreciation in 2017 would increase 70% (to a total of $1,075,000), due to the substantial increase in assets that were going to be needed. Finally, Chris said that her banking contract indicted that interest expense should be about 8% of both notes payable and long term debt in 2017.
By the end of 2016, the firm would be operating at capacity; it was estimated that further growth in 2017 would require $6,500,000 (including all depreciation â that is, adding $6.5 million to the 2016 Net PP&E to derive PP&E for 2017) in plant upgrades and additions to meet anticipated production volume. Everyone felt that all other asset categories (including cash) and current liabilities (including the line of credit) would change by percent of revenue. Both owners were concerned about where any needed external financing would come from. Neither was interested in raising any further equity, and agreed that they would likely secure long term financing for any external funds needed. The plan was to pay dividends totaling $400,000 in 2017.
Chris knew that a key exhibit would be the forecast mode. She planned to set up the model so that a key input would be the sales growth forecast. The âplugâ to reconcile the balance sheet would be long term debt.
Q U E S T I O N S (please use full sentences)
1) Completed forecast model. Fill in all blanks for the 2017 and 2017 % of rev columns.
2) Compare PM, ROA, and ROE from 2016 to 2017. Why the differences?
3) Compare debt ratios from 2016 to 2017. Why the differences?
4) Compare total asset turnover from 2016 to 2017. Why the difference? What observations can you make regarding capacity utilization from 2016 to 2017?
5) Estimate the maximum revenue possible given the new level of assets in 2017, based on TATO in 2016 (at full capacity).
6) If COGS could be decreased by 1% of revenue, how much increase in EBIT would result? Express the change in EBIT in both dollar terms and % change.
7) Do a DuPont analysis on S&S Air for both 2016 and 2017. If the owners asked you for any issues or concerns about the basic results forecasted for 2017, what would you tell them? Consider operating, investing, and financing issues.
7a) Operating comments:
7b) Investing comments:
7c) Financing comments:
| Income statement | 2016 | % rev | 2017 | % rev | ||
| Sales | $21,566,000 | 100.0% | 17%% | |||
| COGS | 14,786,000 | 68.6% | % of rev | 68.6% | ||
| Other expenses | 2,375,000 | 11.0% | % of rev | 11.0% | ||
| Depreciation | 625,000 | 2.9% | given | 1,075,000 | ||
| EBIT | 3,780,000 | 17.5% | calc | |||
| Interest | 437,000 | 2.0% | given | 8.0% | ||
| Taxable income | 3,343,000 | 15.5% | calc | |||
| Taxes (40%) | 1,337,200 | 6.2% | calc TI * tax rate | 40.0% | ||
| Net income | 2,005,800 | 9.3% | calc | |||
| Dividends | 375,000 | 1.7% | given | 400,000 | ||
| Add to RE | 1,630,800 | 7.6% | calc |
| B A L A N C E S H E E T | ||||||
| 2016 | % rev | 2017 | % | |||
| Current Assets | ||||||
| Cash | 425,000 | 2.0% | % of rev | 2.0% | ||
| Accounts rec. | 855,000 | 4.0% | % of rev | 4.0% | ||
| Inventory | 689,000 | 3.2% | % of rev | 3.2% | ||
| Total CA | 1,969,000 | 9.1% | calc | |||
| Fixed assets | ||||||
| Net PP&E | 9,873,000 | 45.8% | given | 6,500,000 | ||
| Total Assets | 11,842,000 | 54.9% | calc | |||
| Current Liabilities | ||||||
| Accounts Payable | 727,000 | 3.4% | % of rev | 3.4% | ||
| Notes Payable | 1,467,000 | 6.8% | % of rev | 6.8% | ||
| Total CL | 2,194,000 | 10.2% | calc | |||
| Long-term debt | 2,908,800 | 13.5% | PLUG | |||
| TOTAL CL + LTL | 5,102,800 | |||||
| Shareholder Equity | ||||||
| Common stock | 120,000 | 0.6% | no change | |||
| Retained earnings | 6,619,200 | 30.7% | +2017 RE | |||
| Total Equity | 6,739,200 | 31.2% | calc | |||
| Total L&E | 11,842,000 | 54.9% | calc | |||
| Ratio Analysis | ||
| 2016 | 2017 | |
| PM | ||
| ROA | ||
| ROE | ||
| Debt / Equity | ||
| Debt / Total Assets | ||
| Equity Multiplier | ||
| Total Asset TO |
Thank you