BIOL 373 Lecture Notes - Lecture 11: Biostatistics, Null Hypothesis, Analysis Of Variance

Document Summary
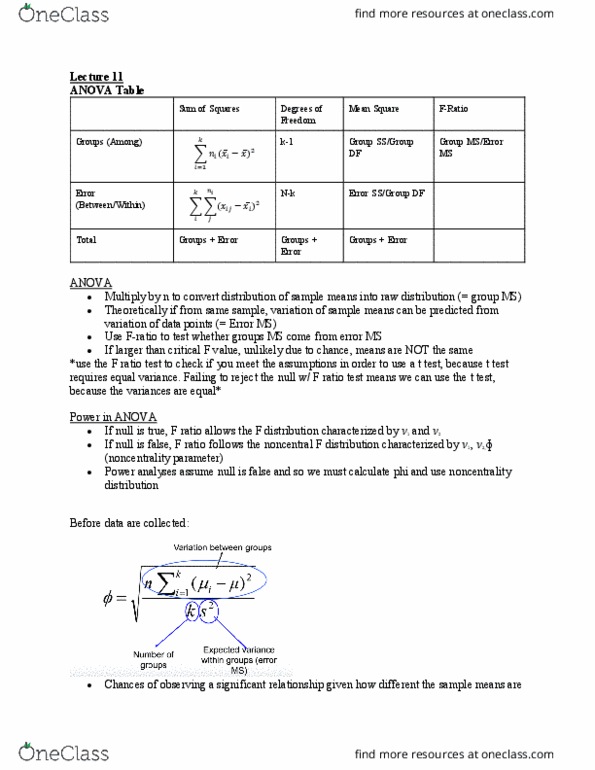
If f larger than critical value, unlikely due to chance. If h0 is true, f ratio follows the f distribution characterized by 1, 2. If h0 is false, f ratio follows the noncentral f distribution characterized by 1, Power analyses assume h0 is false: we must calculate and use the noncentral f distribution. Observing component parts allows you to better understand the distribution. Here: similar to f, except true variance between population means in groups generating observed values ( ) o o. Smallest difference we want to detect between the two most different. B. 1 (zar: depends on 1, , 2 population means (similar to t-test ) Sample size may be required in certain conditions. Continue guessing n until the desired power is achieved. 2k s2: specify , 1 (k 1), 2 and power (1 , use appendix fig. B1 to calculate : specify s2, k and n, and use equation to calculate .