GEOG 217 Lecture 4: Lecture 4

7 Feb 2017
School
Department
Course
Professor
Document Summary
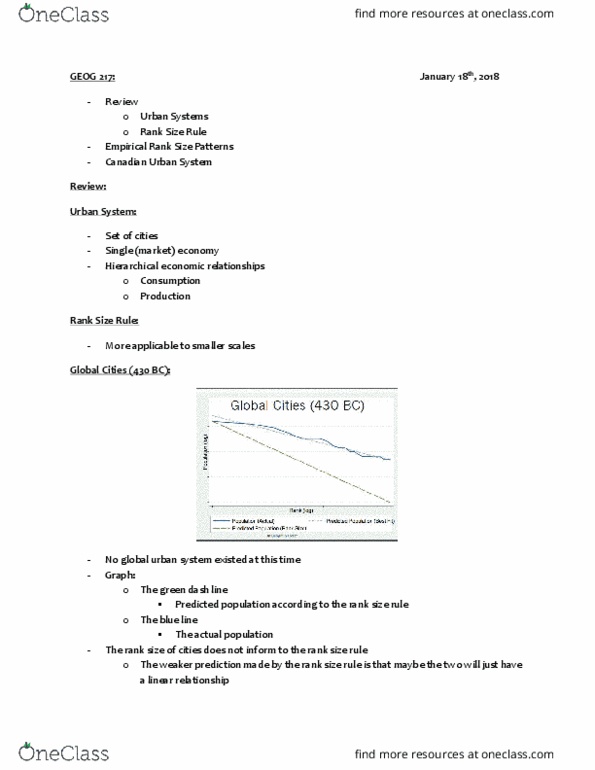
Both consumption and production create hierarchy in cities: rank size rule (slide 3) Claim 1: cities will conform to rank-size rule. Claim 2: sometimes cities may not conform to rank-size rule, but there would exist a linear relationship (weaker claim). Test case: graph of global cities (430 b. c. ) Given the state of technology, they cannot be of one single urban system. The departure between prediction green line and actual blue line is a negative evidence of rank size prediction. If they were of one single urban system, the data would conform to the green line: graph of global cities (2010) This graph is still not a strong evidence of rank-size rule as they still did not conform to the linear relationship. But the last part (about 20th-25th biggest cities) is almost linear, which conforms to claim 2. These rank-size graphs can be useful to understand relationship of cities at a certain point of time.