MGCR 293 Lecture Notes - Lecture 2: Demand Curve, Complementary Good, Marginal Revenue

4 Apr 2016
School
Department
Course
Professor

Document Summary
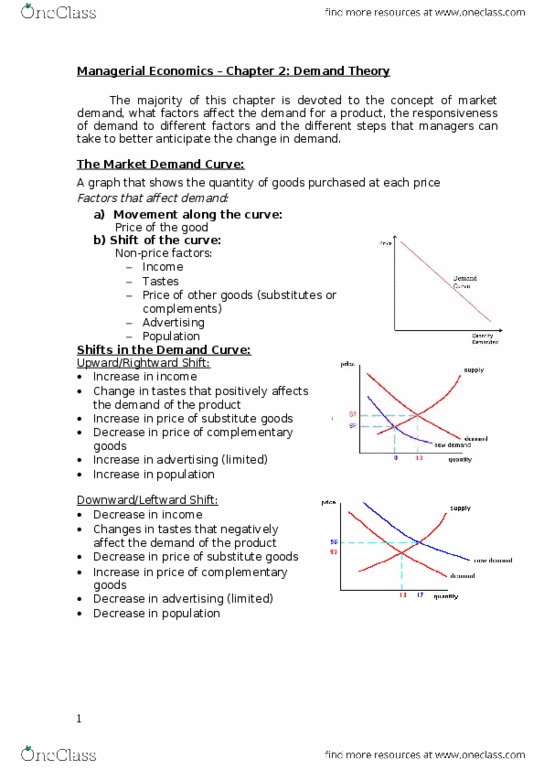
A graph that shows the quantity of goods purchased at each price. Factors that affect demand: movement along the curve, price of the good, shift of the curve, non-price factors: Price of other goods (substitutes or complements) Upward/rightward shift: change in tastes that positively affects the. Increase in price of substitute goods: decrease in price of complementary goods. Downward/leftward shift: decrease in income, changes in tastes that negatively affect the demand of the product. Increase in price of complementary goods: decrease in price of substitute goods, decrease in advertising (limited) This is a numerical measure of the responsiveness or sensitivity of the quantity demanded to changes in price of the product. It is the percentage change in quantity demanded due to one percentage change in price of the product. For example: if the price of candy increases by 1%, then the price elasticity will show how much demand will change in % terms due to the price change.