POLI 311 Lecture Notes - Lecture 7: Standard Deviation, Univariate, Confidence Interval

2 Apr 2016
School
Department
Course
Professor
Document Summary
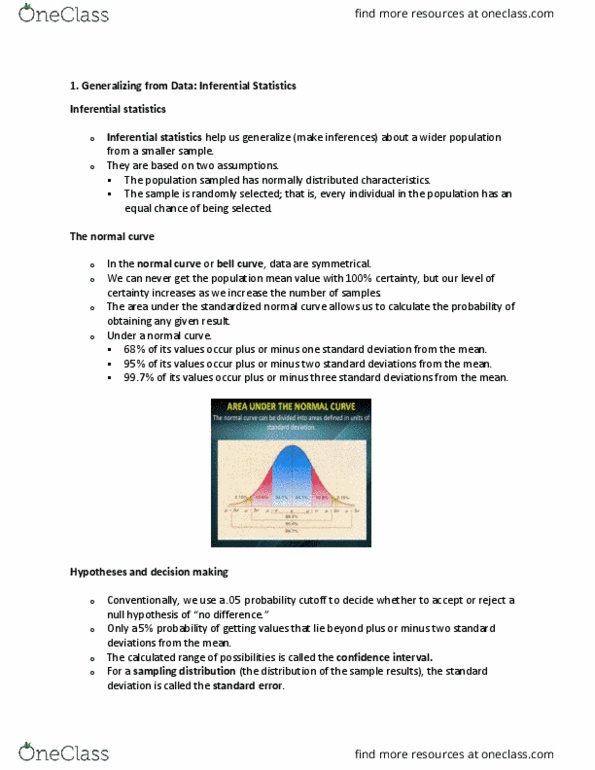
Topic 9: univariate inferenial stats and esimaing sampling error. Always assume that there may be sampling error (any discrepancy between the true populaion value and the value we"ve found from our sample). We use inferenial stats to esimate the probable sampling error. A probability distribuion is a theoreical distribuion that indicates the probability of certain values occurring given certain assumpions about the nature of the distribuion. The normal distribuion takes the form of a symmetrical bell-shaped curve. The mean, median and mode of normally distributed data coincide with the highest point of the curve. If the distribuion is normal, we can use the standard deviaion to interpret the data. 68. 3% of normally distributed data will fall within 1 standard deviaion of the mean. 95. 5% will fall within two standard deviaions of the mean. 99. 7% of will fall within 3 standard deviaions. The percentages refer to the area under the curve.