BIOLOGY 2B03 Lecture Notes - Lecture 6: Scanning Electron Microscope, Electron Microscope, Microscopy

6 Jun 2018
School
Department
Course
Professor

Biomembranes and Cell Architecture: Visualizing the Cell
Visualizing Structure of Cell
the illuminating wavelength sets a limit on the smallest object that can be seen •
Light microscopy: •
conventional and fluorescent ◦
uses visible light ◦
Electron microscopy: •
transmission and scanning ◦
beam of electrons ◦
Resolution
resolution (D) = ability to see object and detail •
D = minimum distance between two objects that can be distinguished from •
one another
smaller value of D = better resolution ◦
D = 0.61λ ÷ NA ◦
wavelength of light: shorter wavelengths of light giver higher resolution •
numerical aperture (NA): a measure of the ability to gather light and resolve •
specimen detail
NA closer to 1 = better ◦
to improve resolution: decrease λ and decrease D •
Example: NA = 0.94 and λ = 450 nm •
0.61 (450) ÷ 0.94 =292 nm -> limit of resolution is about 300 nm (limit on size of objects seen under ◦
microscope)
in electron microscopy, limit of resolution is 0.1 nm to 10 nm ◦
in UV light, limit is 200 - 300 nm ◦
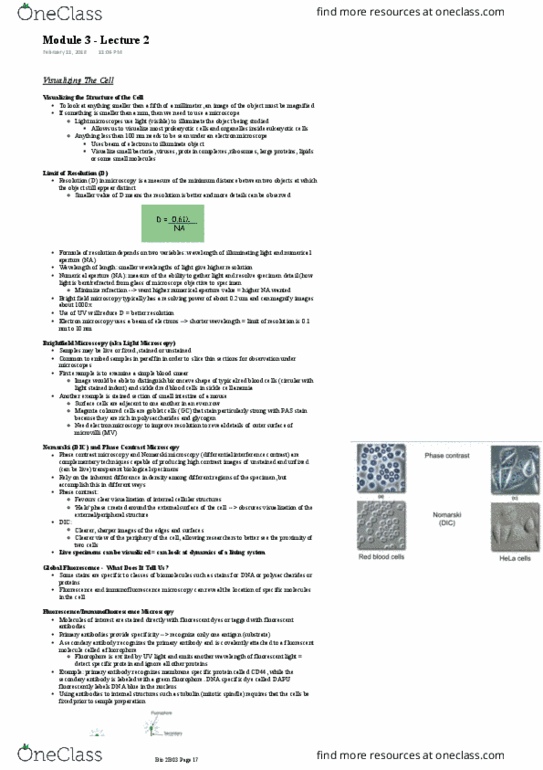
Nomarski and Phase Contrast Microscopy
complementary techniques capable of producing high contrast images of unstained and unfixed biological •
specimens
phase contrast favours clear visualization of internal cell structures (top picture) •
DIC (Nomarski) provides clearer images of edges and surfaces - can better see proximity of two cells •
live specimens can also be examined ◦
Immunofluorescence Microscopy
molecules of interest stained with fluorescent dyes or tagged with fluorescent antibodies •
primary antibodies provide specificity - recognize one antigen (the target substrate/protein) •
secondary antibody recognizes primary and gets covalently attached to •
fluorescent molecule called fluorophore
fluorophore excited by UV light and emits another wavelength of ◦
fluorescent light
this allows only detection of POI •
GFP (Green Fluorescent Protein) is naturally occurring protein in jelly fish •
using DNA technology, can fuse gene coding for POI and gene for GFP ◦
Confocal Scanning Microscopy
technique that allows researcher to get high-resolution images from fluorescently labeled samples •
optical sections created to excite only fluorophores in thin section of sample by using a laser ◦
eliminates background fluorescence to create clear image ◦
Deconvolution Microscopy
Document Summary
Visualizing structure of cell the illuminating wavelength sets a limit on the smallest object that can be seen. Light microscopy: conventional and fluorescent uses visible light. Electron microscopy: transmission and scanning beam of electrons. Resolution resolution (d) = ability to see object and detail. D = minimum distance between two objects that can be distinguished from one another smaller value of d = better resolution. D = 0. 61 na wavelength of light: shorter wavelengths of light giver higher resolution numerical aperture (na): a measure of the ability to gather light and resolve specimen detail. Na closer to 1 = better to improve resolution: decrease and decrease d. Example: na = 0. 94 and = 450 nm. Nomarski and phase contrast microscopy complementary techniques capable of producing high contrast images of unstained and unfixed biological specimens phase contrast favours clear visualization of internal cell structures (top picture)