ECON 1B03 Lecture 1: ECON 1B03- Week 3 Module 2

12 Jan 2019
School
Department
Course
Professor


46
ECON 1B03 Full Course Notes
Verified Note
46 documents
Document Summary
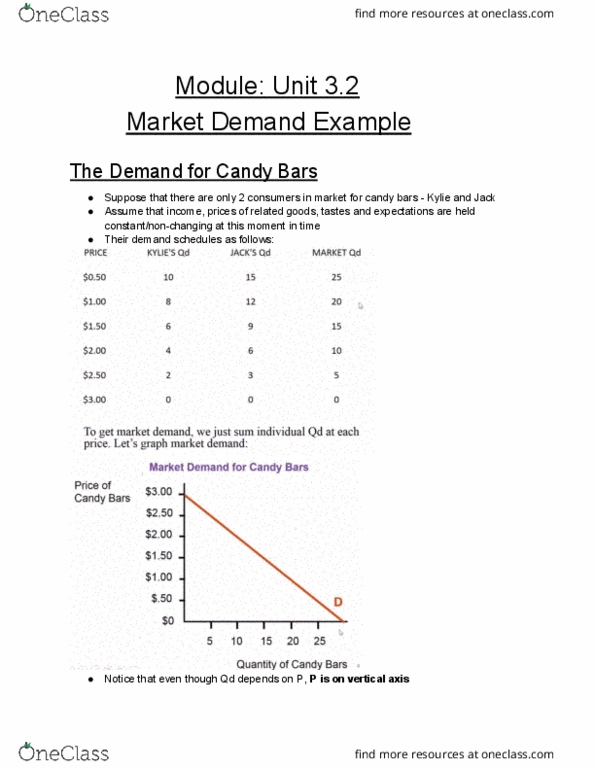
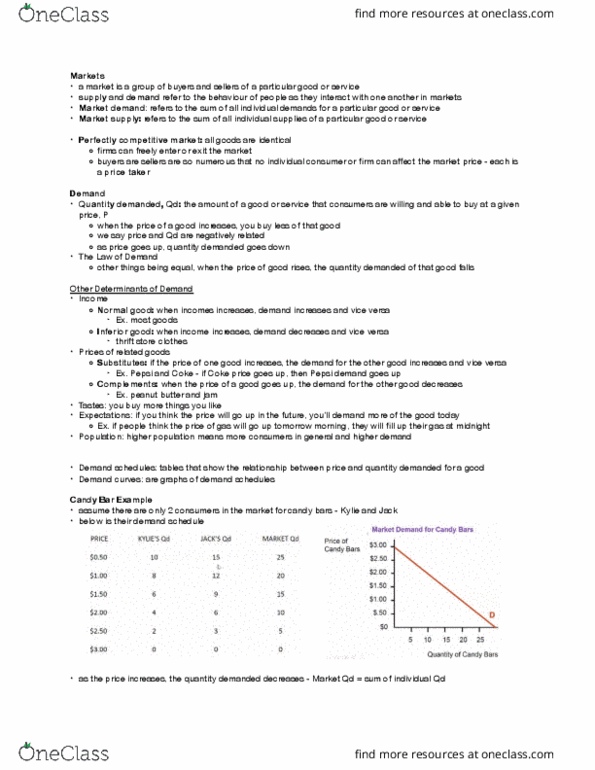
Suppose there are only 2 consumers in the market for candy bars- kylie and jack. We assume that income, prices of related goods, tastes and expectations are held constant-non- changing at this moment in time. To get market demand, we just sum individual qd at each price. Notice that even though qd depends on p, p is on the vertical axis. What we actually graph the inverse demand function where we treat price as a function of quantity. This representation will make later analysis simple and clear. A change in quantity demanded: is movement along the demand curve due to a change in the price of the good. The demand curve itself: does not move. A change in demand: is a shift of the demand curve when anything other than the price of the good changes. An increase in demand: d shifts right. A decrease in demand: d shifts left.