HTHSCI 2RR3 Lecture Notes - Lecture 3: Gini Coefficient, Iqvia, Frequency Distribution

24 Sep 2018
School
Department
Course
Professor
Document Summary
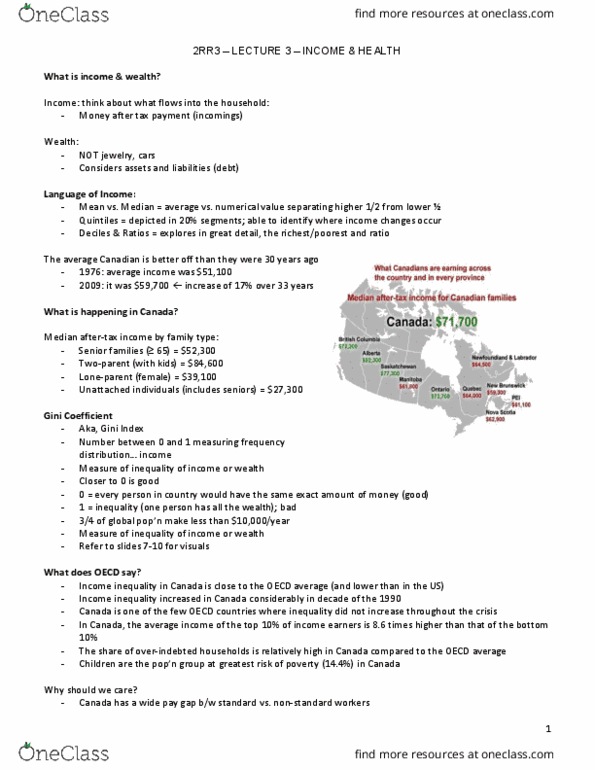
*don"t memorize: median for canada families was 000 in 2012, income varies between families, senior families, 300, 2-parent with kids, 600. Hth sci 2rr3: lone parent (female, 100, unattached individuals, 300. Gini coefficient: aka the gini index, statistical measurement of inequality, between 0-1, measures values of frequency distribution (income, measure of inequality of income or wealth, closer to zero is good, means closer to being equal. Organization for economic cooperation and development (oecd: countries can use each other"s ideas to improve their economies. Gini coefficients in 2014: canada was 0. 32 in 2012, behind some countries in europe. Study: poverty sickens canadians: poverty is the number one contributor to getting sick/illness. Cma report: important: what makes canadians sick, 50%= your life (sdoh, 10%= environment, 15%= biology, 25%= your health care. The cycle: difficult to break: poverty= poor health, poor health can lead to poverty. Hardest hit populations: people of visible minority, when adjusted for .