POLSCI 3NN3 Lecture 3: JAN 12 - FREQUENCY DISTRIBUTIONS with weekly study guide

18 Jan 2017
School
Department
Course
Professor
Document Summary
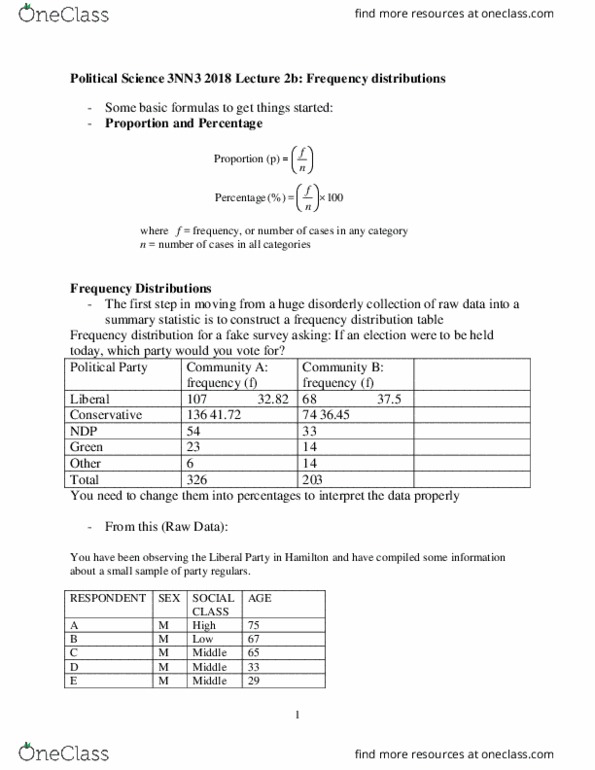
Variables can be measured in different ways: more precisely at certain levels. Before doing any analysis look at the variables and how they are measured. Where f = frequency, or number of cases in any category n = number of cases in all categories. The first step in moving from a huge disorderly collection of raw data into a summary statistic is to construct a frequency distribution table. You are an advisor to the l party. Frequency distribution takes the raw data, summarizes, distills it and gives researcher ability to identify patterns. From this: you have been observing the liberal party in hamilton and have compiled some information about a small sample of party regulars. First: identify level of variables: sex - nominal, social class - ordinal, age - interval-ratio. All frequency tables should have: title. Frequency column: column for percentage, total (n) The way you list variables, order does not matter.