POLSCI 3NN3 Lecture Notes - Lecture 3: Frequency Distribution, Summary Statistics

24 Jan 2018
School
Department
Course
Professor
Document Summary
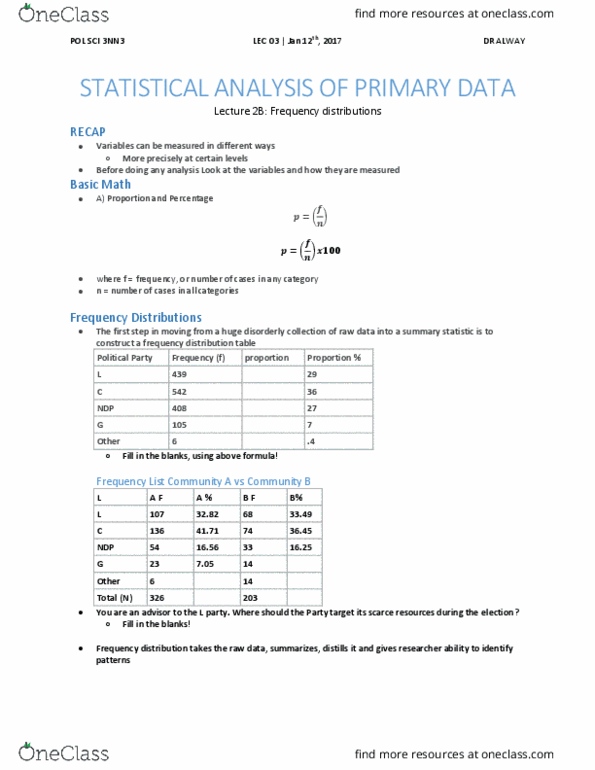
Political science 3nn3 2018 lecture 2b: frequency distributions. Some basic formulas to get things started: 100 where f = frequency, or number of cases in any category n = number of cases in all categories. The first step in moving from a huge disorderly collection of raw data into a summary statistic is to construct a frequency distribution table. You need to change them into percentages to interpret the data properly. You have been observing the liberal party in hamilton and have compiled some information about a small sample of party regulars. Sex of respondents, sample of liberal party of hamilton. First thing you do is pick out the variables. Second, you need to list the attributes in order. Social class of respondents, sample of liberal party of hamilton. The listing of the categories of the variable should reflect the intrinsic rank from low to high or from high to low. Age of respondents, sample of liberal party of hamilton.