PSYCH 1F03 Lecture Notes - Lecture 4: Standard Deviation, Central Tendency, Histogram

31 Dec 2016
School
Department
Course
Professor
Document Summary
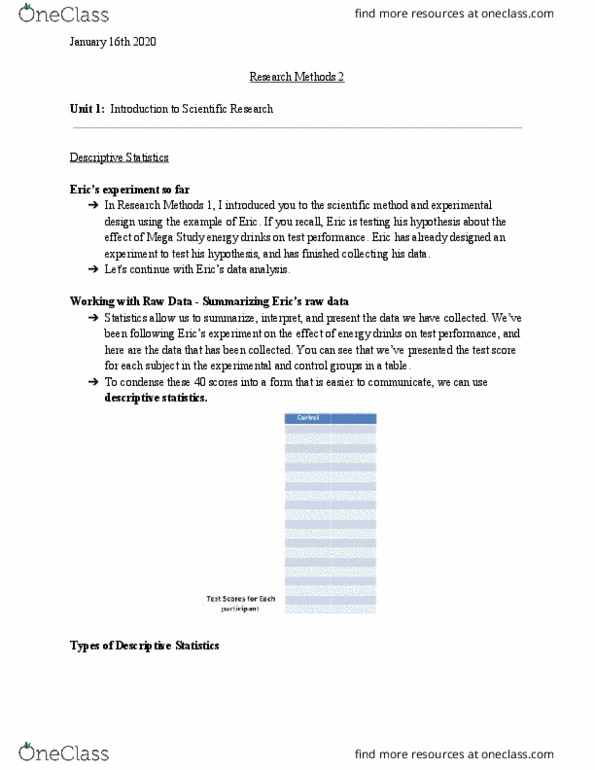
Statistics allows us to summarize, interpret, and present the data we have collected. You can see that we"ve presented the test score for each subject in the experimental and control groups in a table. To condense these 40 scores into a form that is easier to communicate, we can use descriptive statistics. Descriptive statistics present information about data at-a-glance to give you an overall idea of the results of the experiment. This includes summary statistics that you are already familiar with, including the mean, median, and mode. Pie graphs, charts and venn diagrams can be used to visually summarize information that is communicated to the reader instantly. A histogram is a type of graph used to report the number of times groups of values appear in a data set. The horizontal x-axis is divided into groups of values called bins. The vertical y-axis measure the number values in the data set that fall into a given bin.