PSYCH 1X03 Lecture Notes - Lecture 3: Confounding, Design Of Experiments, Summary Statistics

9 May 2016
School
Department
Course
Professor
Document Summary
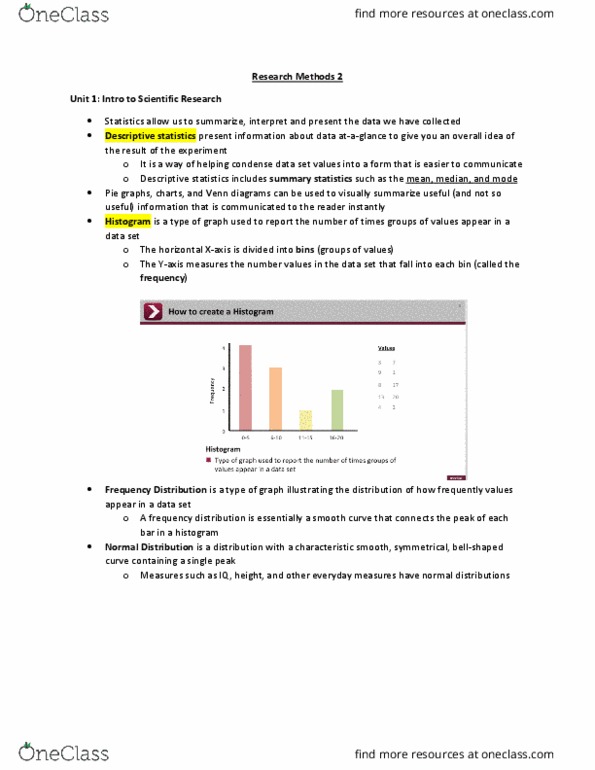
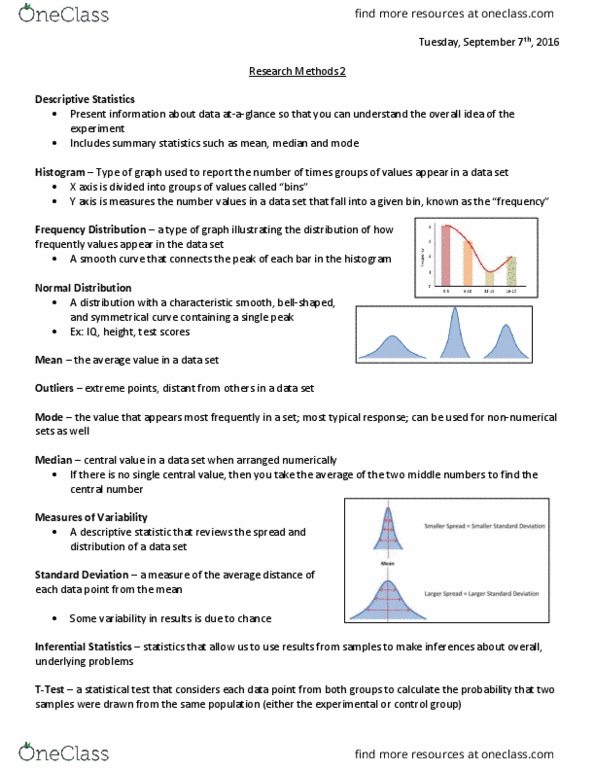
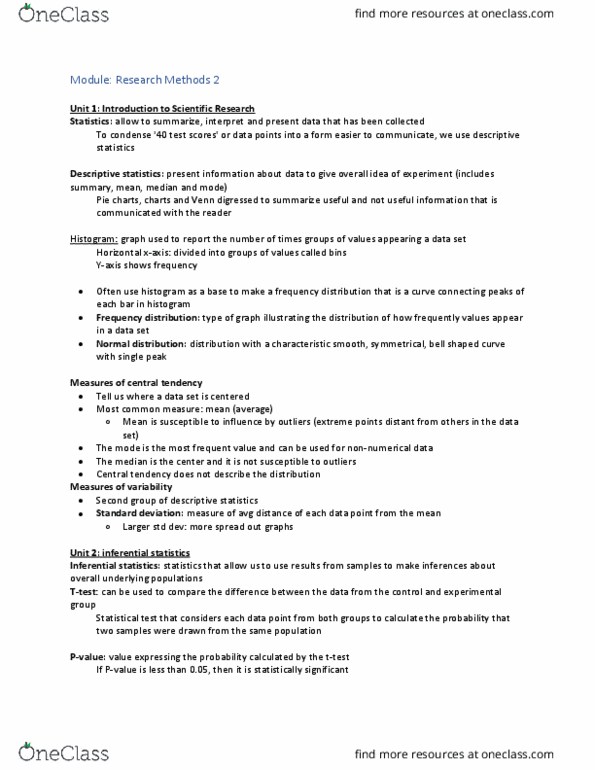
Descriptive statistics: presents an overall-idea of the data from an experiment, includes summary statistics (mean, median, mode) Histogram: type of graph used to report the frequency of values in a data set: bins: groups of values on the x-axis, spans five digits, y-axis measures the frequency of the values. Frequency distribution: type of graph illustrating the distribution of how frequent values appear in the data set, essentially a smooth curve that connects the peak of each bar in a histogram. Normal distribution: a distribution with a characteristic smooth, bell-like and symmetrical- shaped curve around a single peak. Median is more resistant to change by an outlier than the mean. Standard deviation: a measure of the average distance of each data point from the mean, data sets with larger standard deviation are more spread out. Statistics that allow us to use results from samples to make inferences about overall, underlying population.