SOCSCI 2J03 Lecture Notes - Lecture 8: Weighted Arithmetic Mean, Frequency Distribution, Central Tendency

25 Jan 2019
School
Department
Course
Professor
SOCSCI 2J03 verified notes
8/27View all
Document Summary
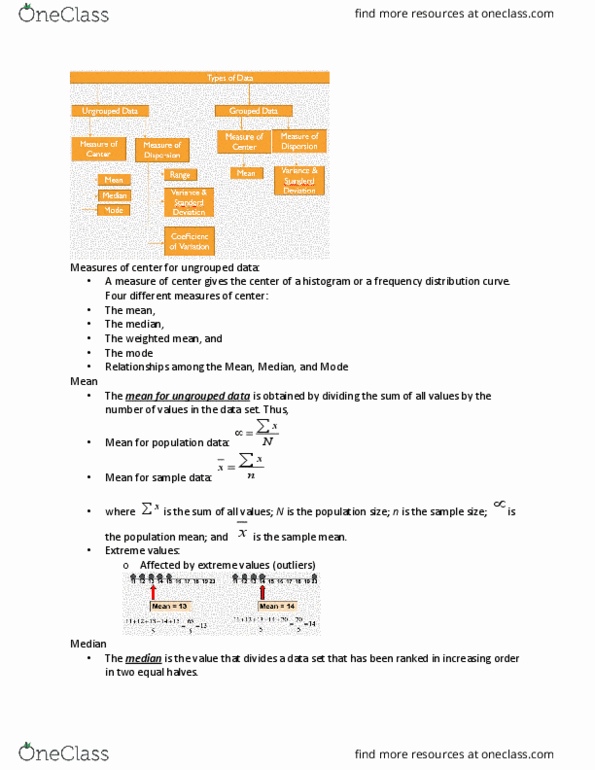
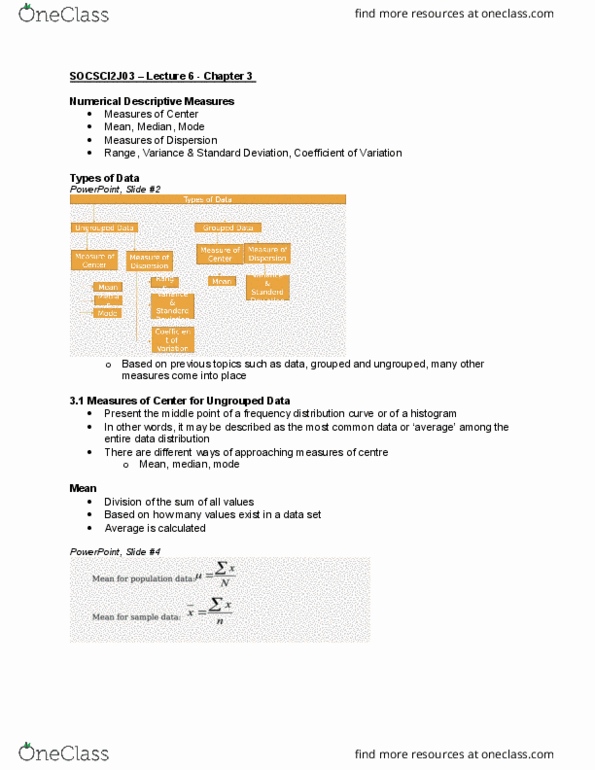
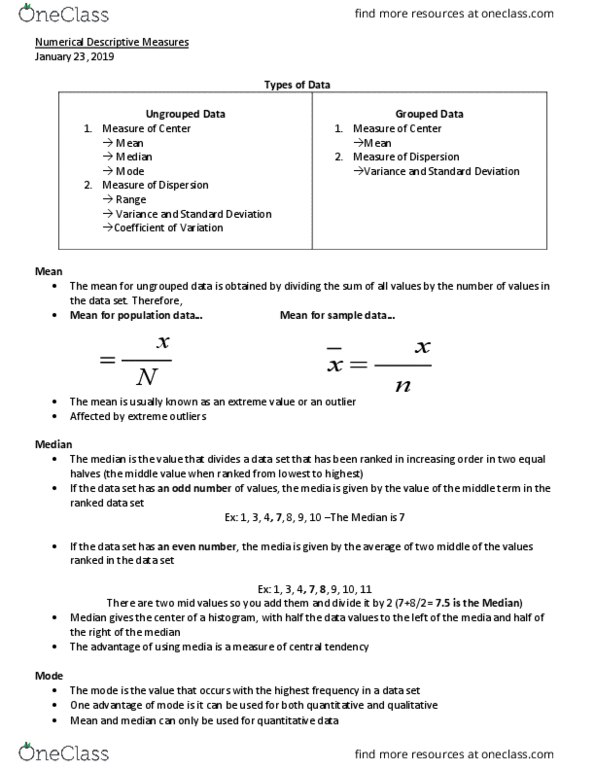
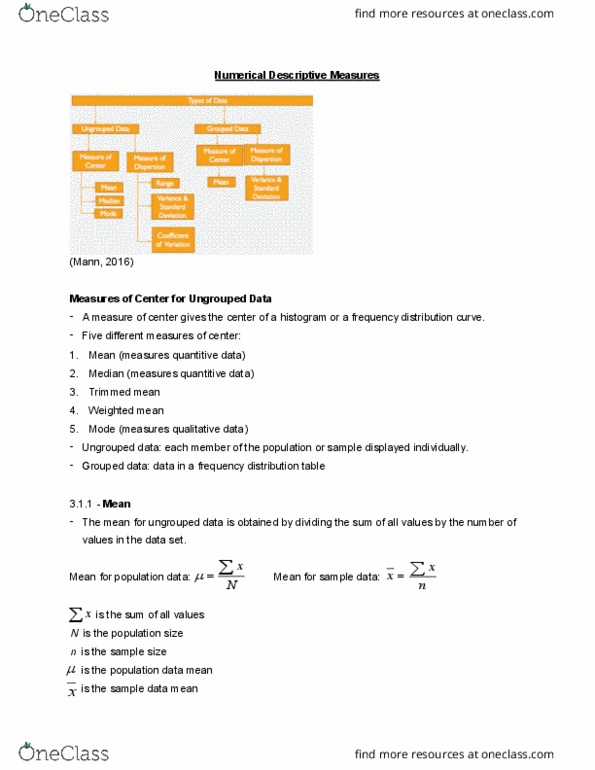
A measure of center gives the center of a histogram or a frequency distribution curve. Five different measures of center: mean (measures quantitive data, median (measures quantitive data, trimmed mean, weighted mean, mode (measures qualitative data) Ungrouped data: each member of the population or sample displayed individually. Grouped data: data in a frequency distribution table. The mean for ungrouped data is obtained by dividing the sum of all values by the number of values in the data set. Mean for population data: mean for sample data: x . X is the sum of all values. N is the population size n is the sample size is the population data mean is the sample data mean x. Find the mean of 2014 profits for these 10 companies: (mann, 2016) Add the total profits of all 10 companies then, calculate their mean value. Solution: the 10 companies earned an average of. ,070. 3 million profits in 20 070 300.