STATS 2B03 Lecture : Descriptive statistics.docx

19 Jun 2013
School
Department
Course
Professor
Document Summary
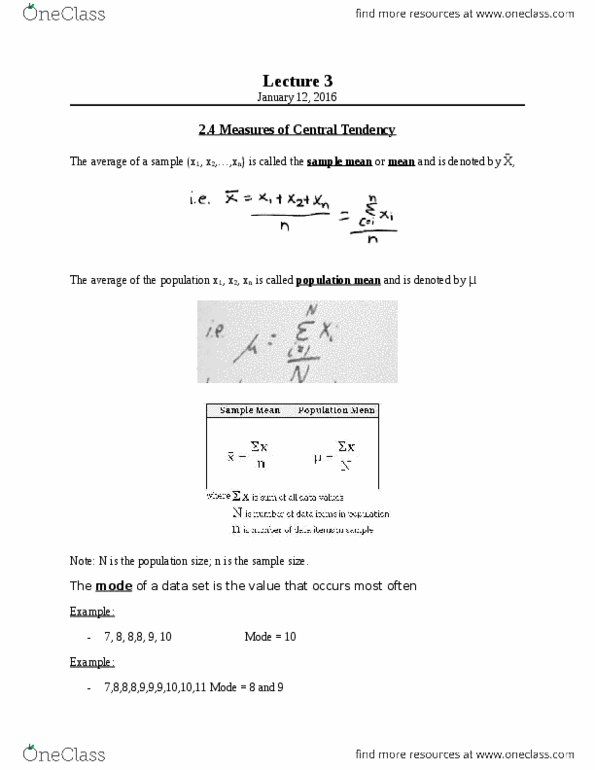
Example: 2. 8, 2. 9, 3. 0, 3. 2, 5. 4, 6. 7, 6. 9. Note that n is the population size the mode of a data set is the value that occurs most often. E. g. 7, 8, 8, 8, 9, 9, 10, mode=8. E. g. 7, 8, 8, 8, 9, 9, 9, 10, 10, 11, two modes: 8 and 9 in a grouped data set the modal class is the group with the largest frequency. E. g. grouping and frequency table: modal class would be the group with the highest frequency which in this case was the grouping 60-70, the modal class if all are the same number all are modal classes. And is also equal to s2 = (x12+x22+ +xn2-nxavg2)/(n-1) Measures how spread out the data is. Never round xavg when calculating s2 the population variance of x1, x2, , xn 2=n i=1 (xi- )2/n. Example: 55, 63, 72, 41, 87, 75, 64, 60.