HPED 2030 Lecture Notes - Lecture 5: Epidemiology, Pearson Product-Moment Correlation Coefficient, Predictive Modelling

29 Apr 2016
School
Department
Course
Professor
Document Summary
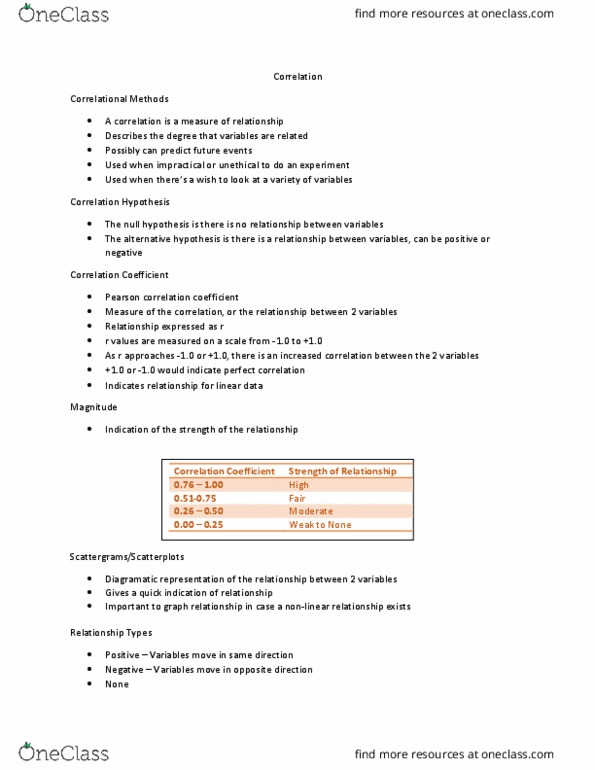
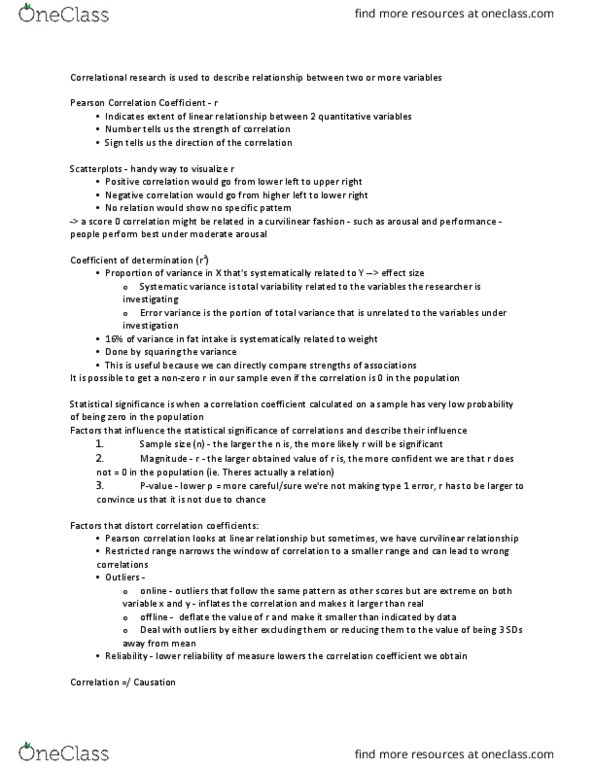
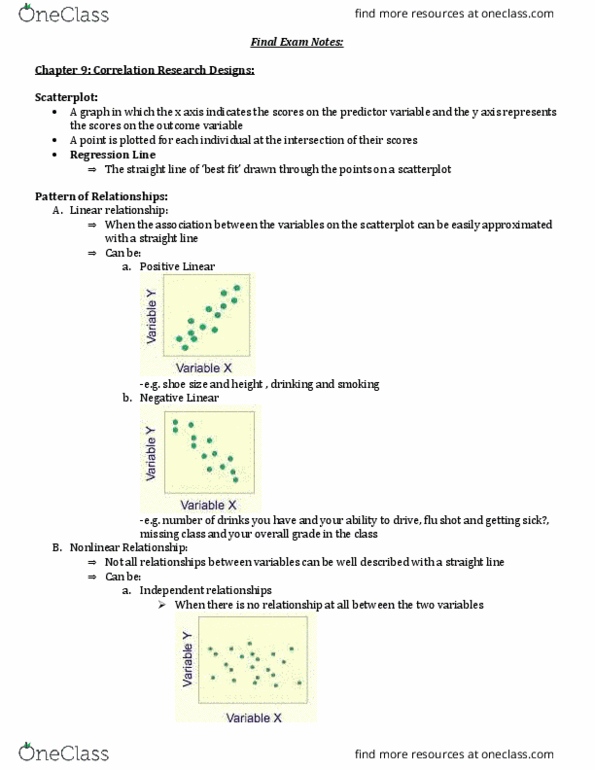
Review assigned reading notes: what is a correlation? statistic that provides a quantitative means of expressing a relationship, and it is used widely in research, what does it express? expresses a relationship. Pearson correlation coefficient: measures correlation between 2 variables, magnitude. When reading the data the researcher/reader can misinterpret the results. Assuming the correlation is causal and that one variable causes changes in the other. Experimental research required to prove causality and directionality. Example: relationship between birth control and electrical appliances. Hped 2030 statistics & research methods | correlation. The curved nature of the relationship decreases the observed correlation coefficient. Researcher must graph data (especially r=~0. 0) to make sure it is not curvilinear. An epidemiologist research team has found a strong positive correlation between the amount of time that children watch television and their 2. 4 km (1. 5 mile) run time.