GPHY 209 Lecture Notes - Lecture 13: Medieval Warm Period, Climatology, 2Degrees

26 Nov 2017
School
Department
Course
Professor
Document Summary
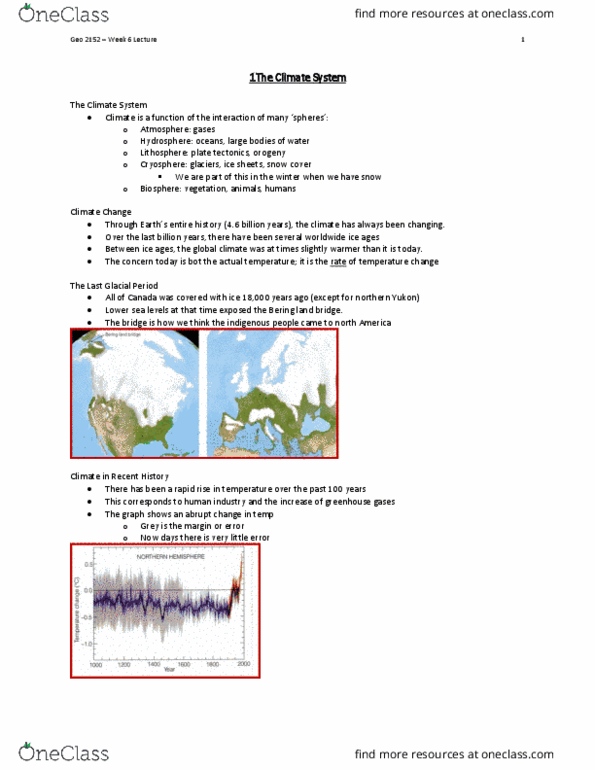
Glacial/interglacial: graph, global surface temperature varies, goes below 12 ( ice age) The holocene: graph, same scale as last graph, relatively warm, last period since the last glaciation, period is when humans are present fluctuating up and down variation. The past millennium (cid:494)the medieval warm period(cid:495), the (cid:494)little ice age(cid:495) It states: diminished incoming solar radiation at the northern latitudes would increase snow and ice, which increases the earth(cid:495)s albedo, which increases the snow and ice. Hockey stick graph : temperature and co2. Correlation isn(cid:495)t causation things going on that co2: there is a human impact, but more about the associations there are more. More complex models: greater spatial resolution, smaller grid cells, more vertical layers, boundary climate interactions have a greater reach, more complex algorithms, sea ice processes, deep ocean processes, soil moisture, transpiration, and humidity effects are modeled. Output of a global model: global map, show on every grid cell how things are changing.