GPHY 247 Lecture Notes - Lecture 8: Multivariate Normal Distribution, Null Hypothesis, Sampling Distribution

4 Apr 2016
School
Department
Course
Professor
Document Summary
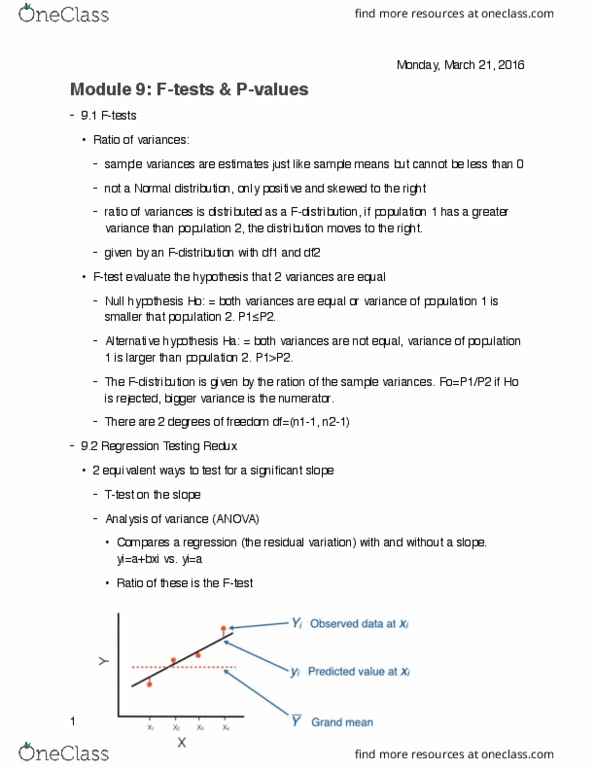
7. 1 correlation: correlation: describes the relationship between two (or more) numerical variables. The sample correlation coef cient (r) measures the strength and direction of the linear association between the variables. Population correlation coef cient is p: signi cance testing. Sample units are drawn from a bivariate normal distribution. Sample variation is not the same as the population correlation coef cient because its a subset of the population. Test for signi cance follows the same 4 steps as the t tests and chi square tests: step 1: state the null and alternative hypothesis. Intercept: ho: ba=a, ha: ba not = a. slopeho: bb=0, ha: bb not = 0: step 2: establish your null distribution and test statistic, step 3: conduct the statistical test, step 4: draw conclusions. Sampling distribution of the sample correlation coef cient (r) follows a t- distribution. 7. 2 linear regression i (not bivariate) (can be used as the same as single sample t tests: linear regression.