PSYC 202 Lecture Notes - Lecture 5: Marginal Distribution, Contingency Table

29 Oct 2018
School
Department
Course
Professor
Document Summary
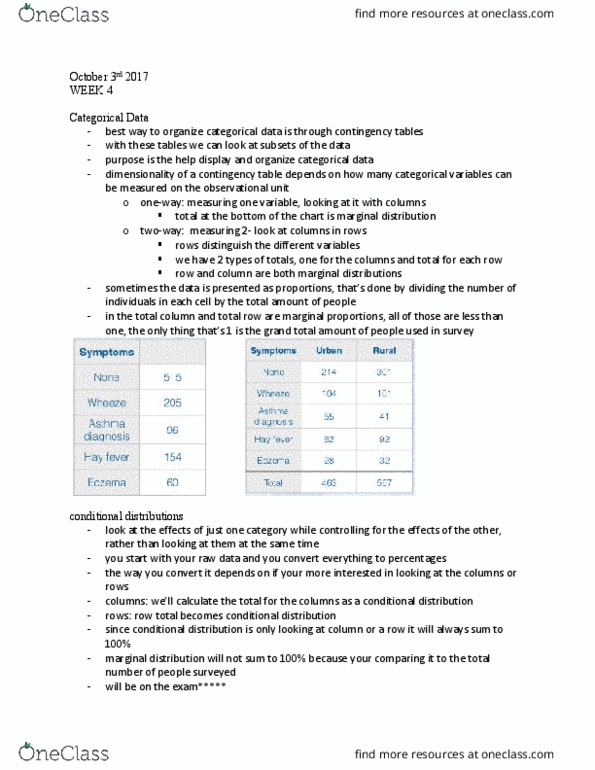
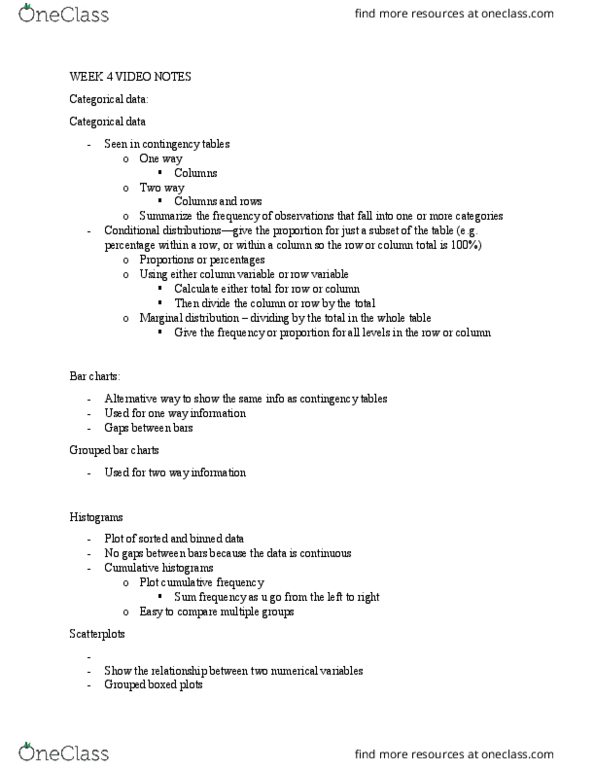
A contingency table shows the frequency (or proportion) of sampling units in each level of a categorical variable: preferred method is to use frequencies because it shows the raw data. If proportions are used, the table should include the total number of sampling units as a note. 1-way and 2-way categorical data: 1-way contingency tables and 2-way contingency tables refer to the number of categorical variables you observe for each sampling unit, 1 categorical variable- 1 way, 2 categorical variables- 2 way. Conditional distributions: conditional distributions are the relative frequencies of one categorical variable, calculated as the frequency from the contingency table divided by the marginal distribution of the primary variable (1) identify the primary vs. secondary variable. This determines whether you use the row or column marginal distribution (2) for each cell in the new table, divide the value from the contingency table by the marginal distribution of the primary variable.