ACC 100 Lecture Notes - Lecture 3: Histogram

12 Dec 2015
School
Department
Course
Professor
Document Summary
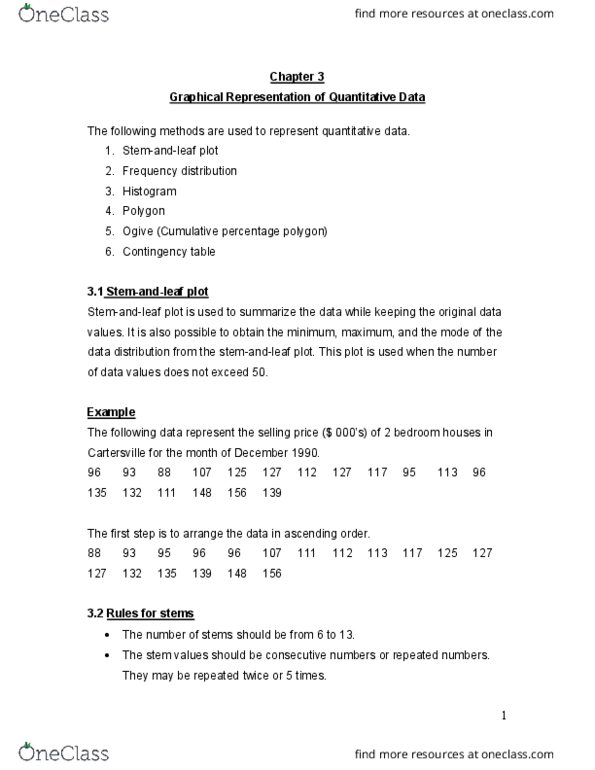
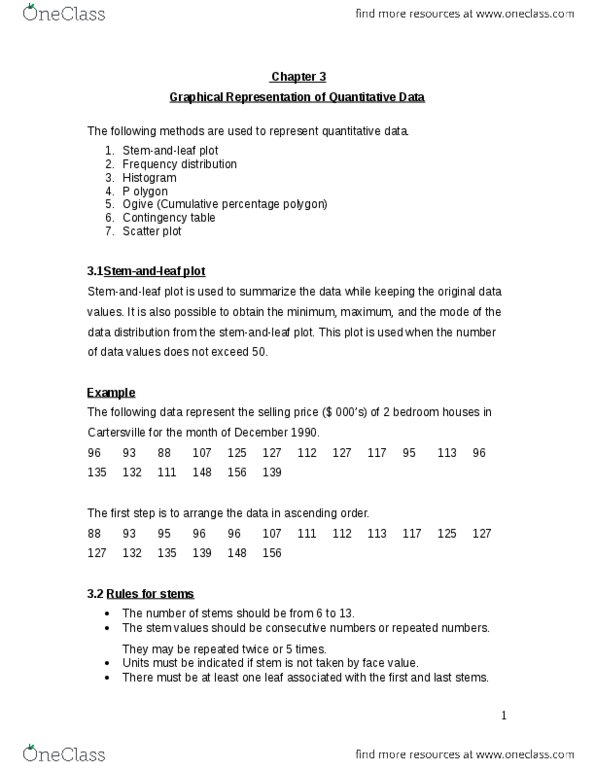
The following methods are used to represent quantitative data: stem-and-leaf plot, frequency distribution, histogram, polygon, ogive (cumulative percentage polygon, contingency table, scatter plot. Stem-and-leaf plot is used to summarize the data while keeping the original data values. It is also possible to obtain the minimum, maximum, and the mode of the data distribution from the stem-and-leaf plot. This plot is used when the number of data values does not exceed 50. The following data represent the selling price ($ 000"s) of 2 bedroom houses in. The first step is to arrange the data in ascending order. The number of stems should be from 6 to 13. The stem values should be consecutive numbers or repeated numbers. They may be repeated twice or 5 times. Units must be indicated if stem is not taken by face value. There must be at least one leaf associated with the first and last stems.