ACC 406 Lecture Notes - Lecture 2: Scatter Plot, Regression Analysis, Fixed Cost


Document Summary
Get access


Related Documents
Related Questions
I'll rate do not skip any parts please if you can't dodon't do at all pass it to someone else don't waste my questionthanks ( I need all answers Cost behavior, High low, contributionmargin, Sales mix, target profit Etc)
Cover-to-Cover Company is a manufacturer of shelving forbooks. The company has compiled the following cost data, and wantsyour help in determining the cost behavior. After reviewing thedata, complete requirements (1) and (2) that follow.
| Units | Total | Total | TotalMachine |
|---|---|---|---|
| Produced | Lumber Cost | Utilities Cost | Depreciation Cost |
| 13,000 shelves | $156,000 | $15,950 | $145,000 |
| 26,000 shelves | $312,000 | $30,900 | $145,000 |
| 52,000 shelves | $624,000 | $60,800 | $145,000 |
| 65,000 shelves | $780,000 | $75,750 | $145,000 |
1. Determine whether the costs in the table are variable, fixed,mixed, or none of these.
Variable Cost | Fixed Cost | Mixed Cost | None of these | ||
|---|---|---|---|---|---|
| Lumber | |||||
| Utilities | |||||
| Depreciation |
2. For each cost, determine the fixed portion of the cost, andthe per-unit variable cost. If there is no amount or an amount iszero, enter "0". Recall that, for N= Number of Units Produced,Total Costs = (Variable Cost Per Unit x N) + Fixed Cost. Completethe following table with your answers.
| Cost | Fixed Portion of Cost | Variable Portion of Cost (per Unit) |
| Lumber | ||
| Utilities | ||
| Depreciation |
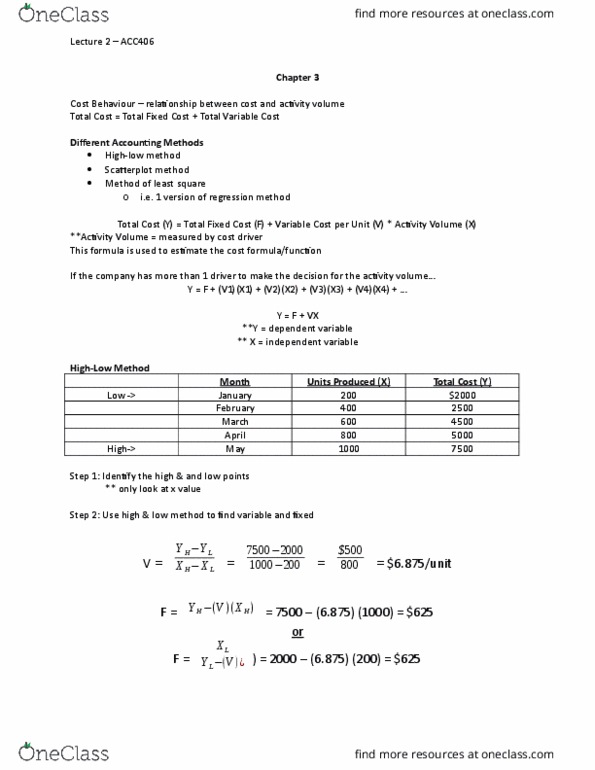
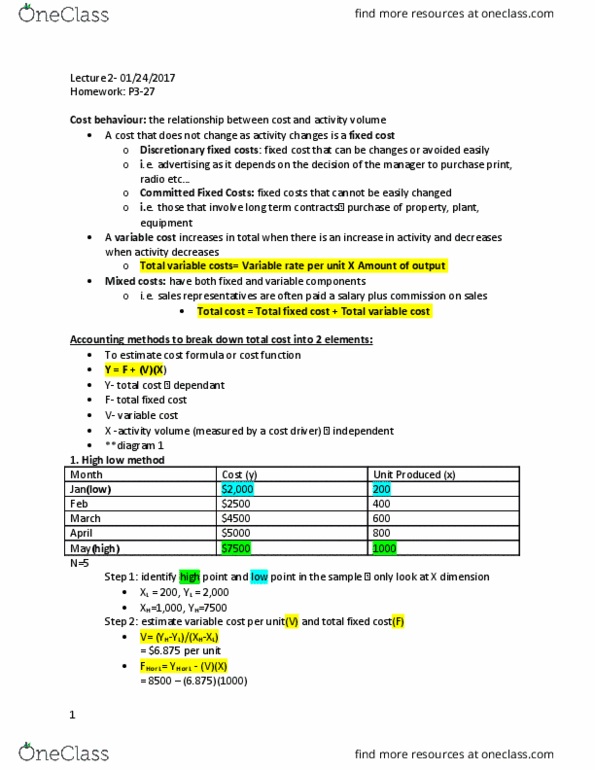
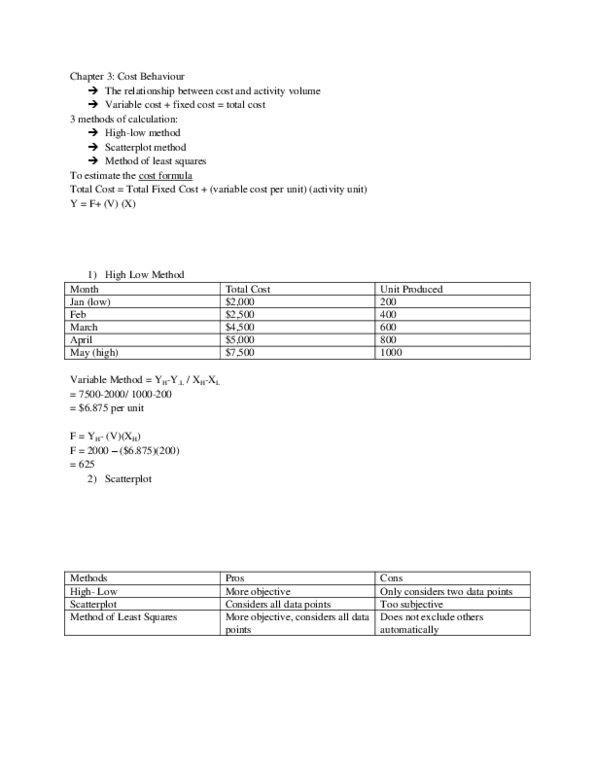
High-Low
Biblio Files Company is the chief competitor of Cover-to-CoverCompany in the bookshelf business. Biblio Files is analyzing itsmanufacturing costs, and has compiled the following data for thefirst six months of the year. After reviewing the data, answerquestions (1) through (3) that follow.
| Month | Number of Units Produced | TotalCost |
|---|---|---|
| January | 4,360 | $65,600 |
| February | 250 | $6,250 |
| March | 1,000 | $15,000 |
| April | 5,250 | $56,250 |
| May | 1,750 | $32,500 |
| June | 3,015 | $48,000 |
1. From the data previously provided, help Biblio Files Companyestimate the fixed and variable portions of its total costs usingthe High-Low Method. Recall that Total Costs = (Variable Cost PerUnit x Units Produced) + Fixed Cost. Complete the followingtable.
| Total FixedCost | Variable Cost perUnit |
2. With your Total Fixed Cost and Variable Cost per Unit fromthe High-Low Method, compute the total cost for the followingvalues of N (Number of Units Produced).
| Number of UnitsProduced | TotalCosts |
| 3,500 | |
| 4,360 | |
| 5,250 |
3. Why does the total cost computed for 4,360 units not matchthe data for January in the table at the top of this panel?
The High-Low method gives accurate data only for levels ofproduction outside the relevant range.
The High-Low method gives a formula for the estimated total costand may not match levels of production other than the highest andlowest.
The High-Low method is accurate only for months in whichproduction is at full capacity.
The High-Low method only gives accurate data when fixed costsare zero.
Contribution Margin
Review the contribution margin income statements forCover-to-Cover Company and Biblio Files Company on their respectiveIncome Statements panels. Complete the following table from thedata provided in the income statements. Each company sold 84,800units during the year.
| Cover-to-Cover Company | Biblio Files Company | |
| Contribution margin ratio (percent) | ||
| Unit contribution margin | ||
| Break-even sales (units) | ||
| Break-even sales (dollars) |
Income Statement - Cover-to-Cover
Cover-to-Cover Company |
Contribution Margin Income Statement |
For the Year Ended December 31 |
1 | Sales | $424,000.00 | ||
2 | Variable costs: | |||
3 | Manufacturing | $212,000.00 | ||
4 | Selling | 21,200.00 | ||
5 | Administrative | 63,600.00 | 296,800.00 | |
6 | Contribution margin | 127,200.00 | ||
7 | Fixed Costs: | |||
8 | Manufacturing | $5,000.00 | ||
9 | Selling | 4,000.00 | ||
10 | Administrative | 54,600.00 | 63,600.00 | |
11 | Income from operations | $63,600.00 |
Income Statement - Biblio Files
Biblio Files Company |
Contribution Margin Income Statement |
For the Year Ended December 31 |
1 | Sales | $424,000.00 | ||
2 | Variable costs: | |||
3 | Manufacturing | $169,600.00 | ||
4 | Selling | 16,960.00 | ||
5 | Administrative | 33,920.00 | 220,480.00 | |
6 | Contribution margin | 203,520.00 | ||
7 | Fixed Costs: | |||
8 | Manufacturing | $121,920.00 | ||
9 | Selling | 8,000.00 | ||
10 | Administrative | 10,000.00 | 139,920.00 | |
11 | Income from operations | $63,600.00 |
Sales Mix
Biblio Files Company is making plans for its next fiscalyear, and decides to sell two new types of bookshelves, Basic andDeluxe. The company has compiled the following estimates for thenew product offerings.
| Type ofBookshelf | SalesPrice per Unit | Variable Cost per Unit |
|---|---|---|
| Basic | $5.00 | $1.75 |
| Deluxe | $9.00 | $8.10 |
The company is interested in determining how many of each typeof bookshelf would have to be sold in order to break even. If wethink of the Basic and Deluxe products as components of one overallenterprise product called âCombined,â the unit contribution marginfor the Combined product would be $2.31. Fixed costs for theupcoming year are estimated at $346,962. Recall that the totals ofall the sales mix percents must be 100%. Determine the amounts tocomplete the following table.
| Type of Bookshelf | Percent of Sales Mix | Break-Even Sales in Units | Break-Even Sales in Dollars |
| Basic | |||
| Deluxe |
Target Profit
Refer again to the income statements for Cover-to-CoverCompany and Biblio Files Company on their respective IncomeStatement panels. Note that both companies have the same sales andnet income. Answer questions (1) - (3) that follow, assuming thatall data for the coming year is the same as the current year,except for the amount of sales. If required, round answers to thenearest dollar.
1. If Cover-to-Cover Company wants to increase its profit by$40,000 in the coming year, what must their amount of sales be?
2. If Biblio Files Company wants to increase its profit by$40,000 in the coming year, what must their amount of sales be?
3. What would explain the difference between your answers for(1) and (2)?
Cover-to-Cover Companyâs contribution margin ratio is lower,meaning that itâs more efficient in its operations.
Biblio Files Company has a higher contribution margin ratio, andso more of each sales dollar is available to cover fixed costs andprovide income from operations.
The companies have goals that are not in the relevant range.
The answers are not different; each company has the samerequired sales amount for the coming year to achieve the desiredtarget profit.
Question 1
Blacken Company manufactures motorcycles. The company'smanagement accountant wants to calculate the fixed and variablecosts associated with utility cost incurred by the factory. Datafor the past six months were collected.
| Month | Utility cost | Machine hours | ||||
| March | $30,255 | 2,200 | ||||
| April | 32,750 | 2,525 | ||||
| May | 34,712 | 2,710 | ||||
| June | 31,850 | 2,410 | ||||
| July | 30,720 | 2,290 | ||||
| August | 29,980 | 2,150 | ||||
Required:
A. Using the high-low method calculate thevariable rate per machine hour for the utility cost. Round youranswer to two decimal places.
$ per machine hour
B. Using the high-low method calculate thefixed cost of utilities. Round your answer to two decimalplaces.
$
C. Construct a cost formula for total utilitycost. Round your answers to two decimal places.
| Total utility cost | = | Fixed cost | + | Variable cost |
| = | $ | + | ($ per hour X no. of machine hours) |
D. Estimate the cost of utilities if 2,425machine hours are used. Round your answer to two decimalplaces.
$
Question 2
Income statements for two different companies in the sameindustry are as follows:
| Company A | Company B | |
| Sales | $400,000 | $400,000 |
| Less: Variable costs | 300,000 | 200,000 |
| Contribution margin | $100,000 | $200,000 |
| Less: Fixed costs | 50,000 | 150,000 |
| Operating income | $50,000 | $50,000 |
Required:
A. Calculate the degree of operating leveragefor each firm.
| Company A: | |
| Company B: |
B. Calculate the margin of safety in dollarsfor each firm.
| Company A: | $ |
| Company B: | $ |
C. Determine the operating income for each firmif sales increase by 20%.
| Company A: | $ |
| Company B: | $ |
