ECN 204 Lecture Notes - Shortage, Management System, Demand Curve


ECN204 – AGGREGATE DEMAND AND AGGREGATE SUPPLY (CHAPTER 12)
12.1 AGGREGATE DEMAND
Aggregate demand – schedule or curve that shows the amounts of a nation’s output (real GDP)
that buyers collectively desire to purchase at each possible price level
• Includes nation’s households, businesses, and government, consumers located abroad
• The relationship between the price level and amount of real GDP demanded is inverse or
negative
• When the price level rises, the quantity of real GDP demanded decreases; when the price
level falls, the quantity of real GDP demanded increases
Aggregate Demand Curve
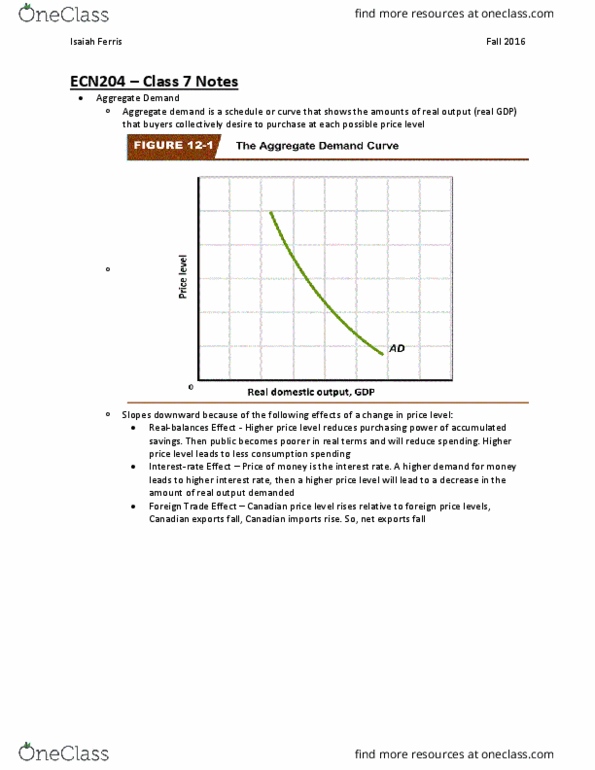
• The inverse relationship between the price level and real GDP is shown in Figure 12-1,
where the aggregate demand curve AD slopes downward, as does the demand curve for
an individual product.
• The downward slope rests on three
effects of a price-level change
• Graph: The downsloping aggregate
demand curve AD indicates an inverse
relationship between the price level
and the amount of real output
purchased
• Slopes downward because of
(1) the real-balances effect
(2) the interest-rate effect
(3) the foreign-trade effect
Real-Balances Effect
Real-balances effect – The inverse relationship between the price level and the real value (or
purchasing power) of financial assets with fixed money value
• Produced through a change in the price level
How it works:
• A higher price level reduces the purchasing power of the public’s accumulated saving
balances.
• In particular, the real value of assets with fixed money values, such as savings accounts or
bonds, diminishes.
• Because a higher price level erodes the purchasing power of such assets, the public is
poorer in real terms and will reduce its spending.
• E.g. A household might buy a new car or a plasma TV if the purchasing power of its
financial asset balances is, say, $50,000. But if inflation erodes the purchasing power of
its asset balances to $30,000, the family may defer its purchase.
• SO a higher price level means less consumption spending
Interest-Rate Effect
Interest-rate effect – The direct relationship between price levels and the demand for money,
which affects interest rates, and as a result, total spending in the economy
• When we draw an aggregate demand curve, we assume that the supply of money in the
economy is fixed.
• But when the price level rises, consumers need more money for purchases, and businesses
need more money to meet their payrolls and to buy other resources.
• E.g. A $10 bill will do when the price of an item is $10, but a $10 bill plus a loonie is
needed when the item costs $11.
• Basically, a higher price level increases the demand for money. So, given a fixed supply
of money, an increase in money demand will drive up the price paid for its use. The price
of money is the interest rate.

• Higher interest rates restrain investment spending and interest-sensitive consumption
spending
• Firms that expect a 6 percent rate of return on a potential purchase of capital will find that
investment profitable when the interest rate is, say, 5 percent.
• But the investment will be unprofitable and will not be made when the interest rate has
risen to 7 percent.
• Similarly, consumers may decide not to purchase a new house or automobile when the
interest rate on loans goes up.
• SO by increasing the demand for money and consequently the interest rate, a higher price
level reduces the amount of real output demanded.
• An increase in real interest rates will lower investment and reduce aggregate demand
Foreign-Trade Effect
Foreign-trade effect – The inverse relationship between the net exports of an economy and its
price level rises relative to price levels in the economies of trading partners
• When the Canadian price level rises relative to foreign price levels, foreigners buy fewer
Canadian goods and Canadians buy more foreign goods.
• Therefore, Canadian exports fall and Canadian imports rise. In short, the rise in the price
level reduces the quantity of Canadian goods demanded as net exports.
Conclusion
• These three effects work in the opposite directions for a decline in the price level
• A decline in the price level increases consumption through the real-balances effect and
interest-rate effect, increases investment through the interest-rate effect, and raises net
exports by increasing exports and decreasing imports through the foreign-trade effect
12.2 CHANGES IN AGGREGATE DEMAND
• Other things equal, a change in the price level will change the amount of aggregate
spending and therefore change the amount of real GDP demanded by the economy.
• Movements along a fixed aggregate demand curve represent these changes in real GDP.
• However, if one or more of those other things changes, the entire aggregate demand curve
will shift.
Determinants of aggregate demand – Factors (such as consumption spending, investment,
government spending, and net exports) that shift the aggregate demand curve
Factors that shift aggregate demand:
1. Change in consumer spending
a. Consumer wealth
b. Consumer expectations
c. Personal taxes
2. Change in investment spending
a. Interest rates
b. Expected returns
• Expected future business
conditions
• Technology
• Degree of excess capacity
• Business taxes
3. Change in government spending
4. Change in net export spending
a. National income abroad

Each determinant of aggregate demand:
1. Consumer Spending
• If those consumers decide to buy more output at each price level, the aggregate demand
curve will shift to the right, as from AD1 to AD2 in Figure 12-2
• If they decide to buy less output, the aggregate demand curve will shift to the left, as from
AD1 to AD3
• Several factors other than a change in the price level may change consumer spending and
thus shift aggregate demand
o Are real consumer wealth, consumer expectations, household borrowing and
taxes
a. Consumer Wealth
Consumer wealth – total dollar value of all assets owned by consumers in the economy less the
dollar value of their liabilities (debts)
• Assets include stocks, bonds, and real estate
• Liabilities include mortgages, car loans, and credit card balances
• Changes suddenly and unexpectedly due to surprising changes in asset values
• Example: unforeseen increase in the stock market
• The increase in wealth prompts pleasantly surprised consumers to save less and buy more
out of their current incomes than they had previously been planning.
• The resulting increase in consumer spending—the so-called wealth effect—shifts the
aggregate demand curve to the right.
• In contrast, an unexpected decline in asset values will cause an unanticipated reduction in
consumer wealth at each price level.
• As consumers tighten their belts in response to the bad news, a reverse wealth effect sets
in.
• Unpleasantly surprised consumers increase savings and reduce consumption, thereby
shifting the aggregate demand curve to the left.
b. Household Borrowing
• Consumers can increase their consumption spending by borrowing. Doing so shifts the
aggregate demand curve to the right.
• By contrast, a decrease in borrowing for consumption purposes shifts the aggregate
demand curve to the left.
• The aggregate demand curve will also shift to the left if consumers increase their saving
rates in order to pay off their debts.
• With more money flowing to debt repayment, consumption expenditures decline and the
AD curve shifts left.
4. Consumer Expectations
• Changes in expectations about the future may change consumer spending
• When people expect their future real income to rise, they spend more of their current
income.
• Thus current consumption spending increases (current saving falls), and the aggregate
demand curve shifts to the right.
• Similarly, a widely held expectation of surging inflation in the near future may increase
aggregate demand today because consumers will want to buy products before their prices
rise.
• Conversely, expectations of lower future income or lower future prices may reduce
current consumption and shift the aggregate demand curve to the left.
c. Personal Taxes
• A reduction in personal income tax rates raises take-home income and increases consumer
purchases at each possible price level.