GMS 401 Lecture Notes - Lecture 8: Statistical Process Control, Control Chart, Process Capability

7 Sep 2017
School
Department
Course
Professor
Document Summary
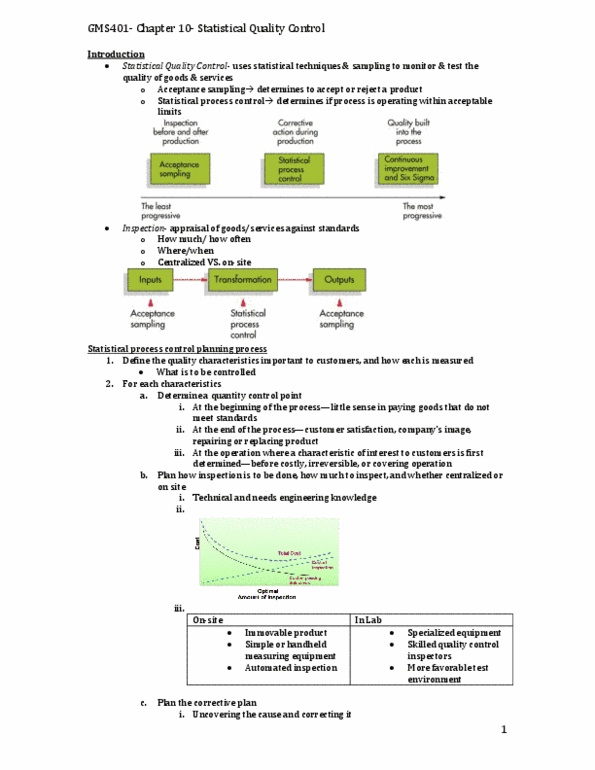
What does the term quality control mean: quality control is an activity that evaluates quality characteristics relative to a standard, and takes corrective action when they do not meet standards. How is quality control accomplished: by monitoring and inspecting the product during process. Statistical process control: statistical evaluation of the output of a process during production, the control process: Evaluate corrective action: variations and control. Random variation: natural variations in the output of process, created by countless minor factors. Assignable variation: a variation whose source can be identified. Control chart: purpose: to monitor process output to distinguish between random and assignable variation, a time ordered plot of sample statistics (means) obtained from an ongoing process, upper and lower control limits define the range of acceptable variation. Control charts for variables: variables generate data that are measured, sample mean control charts. Used to monitor the mean of a process. X-bar charts: sample range control charts.