ITM 410 Lecture Notes - Lecture 6: Data Flow Diagram, System Context Diagram, Flowchart

24 Apr 2015
School
Department
Course
Professor
Document Summary
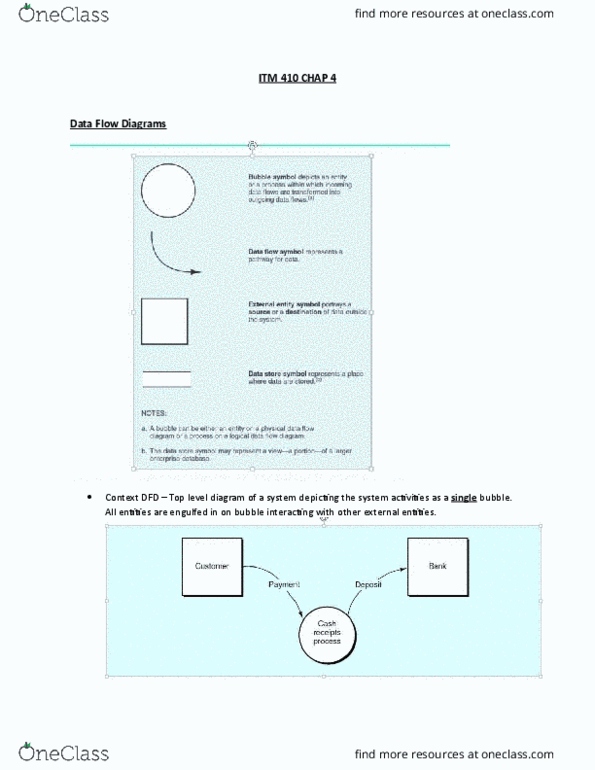
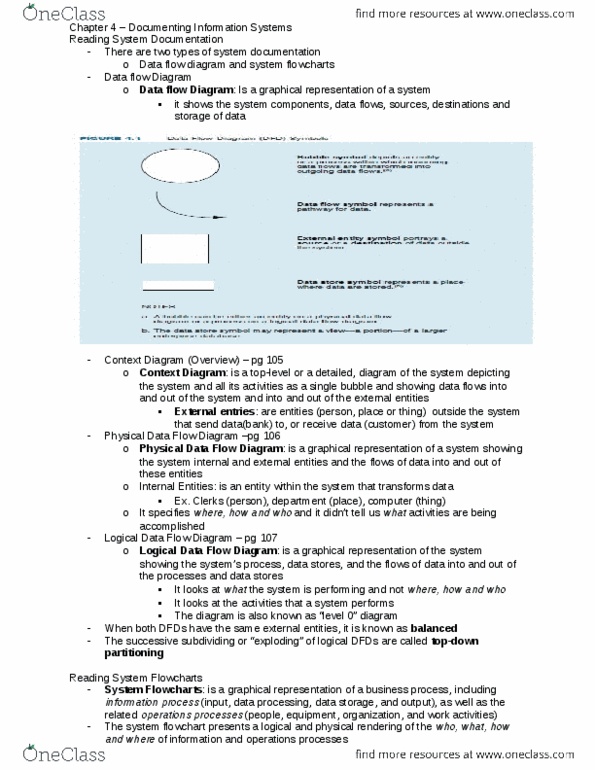
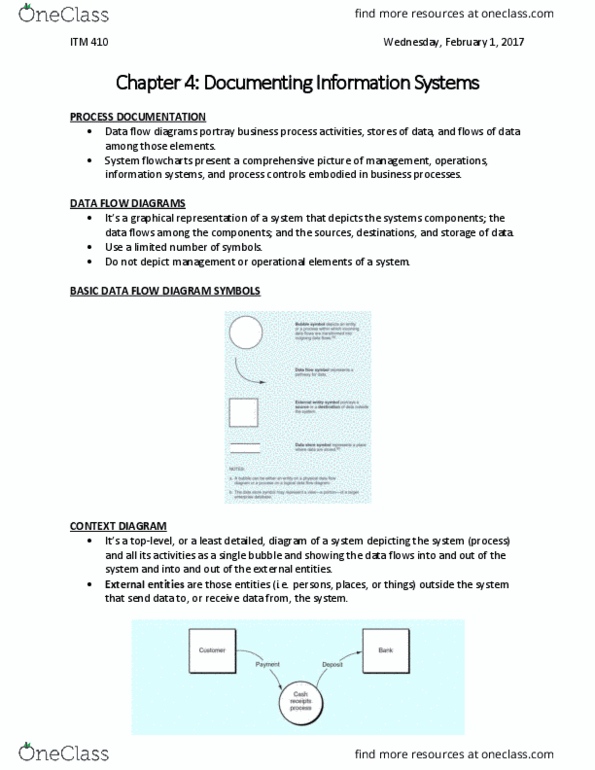
Reading data flow diagrams: a data flow diagram (dfd) is a graphical representation of a system. A dfd depicts a system"s components; the data flows among the components; and the sources, destinations, and storage of data. What a system is doing will change less over time than how the system is doing it. Reading system flowcharts: a systems flowchart is a graphical representation of a business process, including information processes (inputs, data processing, data storage, and outputs), as well as the related operations processes (people, equipment, organization, and work activities). These flowcharts depict the sequence of activities performed as the business events flow through the process. You may, also for clarity to help you determine that you have included all necessary flows, label each flow with the activity number that gives rise to the flow or with a description of the flow.