QMS 102 Lecture Notes - Lecture 1: Six Sigma, Minitab, Cervix

20 Oct 2016
School
Department
Course
Professor

Document Summary
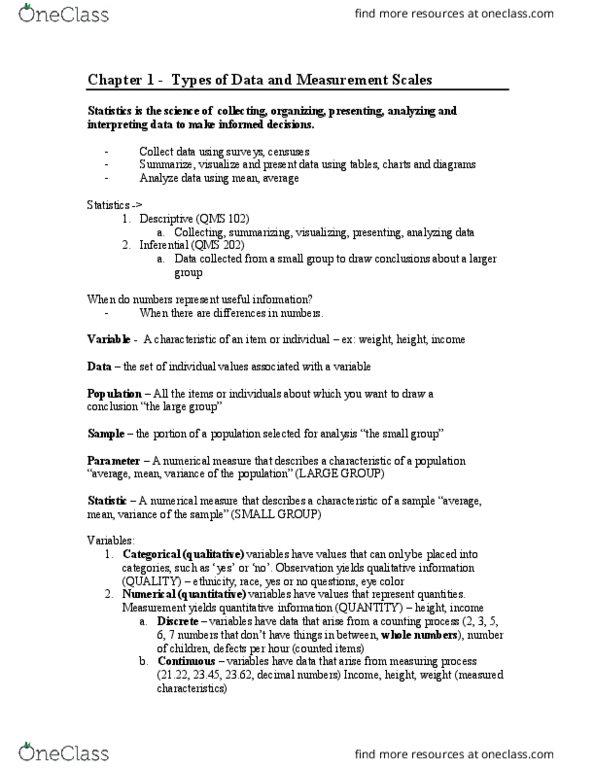
Stats is the science of collecting, organizing presenting, analyzing and interpreting data to make informed decisions. Summarize, visualize, present data ex: tables, charts, diagrams, and graphs. Using data collected from a small group to draw conclusions about a larger group. Estimation estimate the population mean weight using. When are differences in numbers meaningful versus simply due to chance. To draw conclusions from business data (inferential methods used to reach conclusions about a large group based on data from a small group) To make reliable forecasts about business activities (prepare statistical models) To improve business processes (involves managerial approaches like six sigma) Variable- a characteristic of an item or individual ex weight, height, income, test scores. Data- the set of individual values associated with a variable. Population- all the items or individuals about which you want to draw a conclusion. Sample- portio(cid:374) of a populatio(cid:374) selected for a(cid:374)alysis. Parameter- numerical measure that describes a characteristic of a population.