QMS 102 Lecture Notes - Lecture 3: Percentile, Pie Chart, Papyrus 75

10 Nov 2016
School
Department
Course
Professor
Document Summary
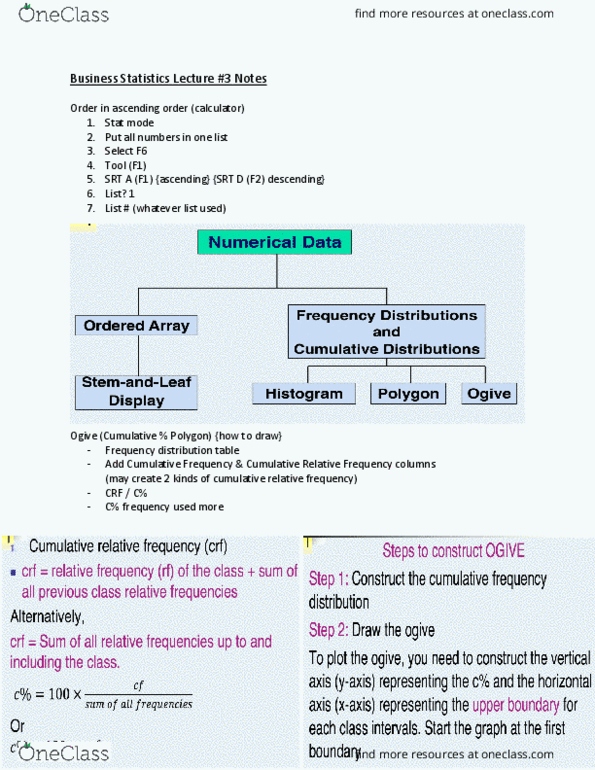
Visualizing numerical data by using graphical displays: how to draw an ogive. Start with a frequency distribution table and add a cumulative frequency column and a cumulative relative frequency column. You may construct two kinds of cumulative relative frequencies. Cumulative relative frequency (crf) crf= relative frequency (rf) of the class + sum of all previous class relative frequencies. Alternatively, crf=sum of all relative frequencies up to and including the class. Both kinds of cumulative frequency will give you the same answer. However, it is more common to use c% to construct the ogive. Visualizing numerical data: the ogive (cumulative % polygon: step 1: construct the cumulative frequency distribution, step 2: draw the ogive. To plot the ogive, you need to construct the vertical axis (y-axis) representing the c% and the horizontal axis (x-axis) representing the upper boundary for each class intervals. C(cid:396)eate ogi(cid:448)e we (cid:272)(cid:396)eate a(cid:374) ogi(cid:448)e i(cid:374) th(cid:396)ee steps : 1) calculate relative frequencies.