QMS 102 Lecture Notes - Total Quality Management, Control Chart, Six Sigma

24 Nov 2012
School
Department
Course
Professor
Document Summary
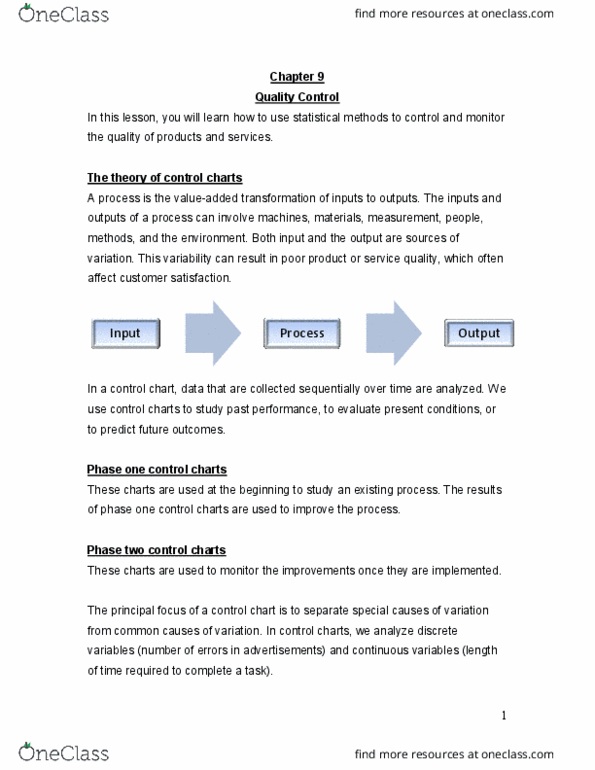
Outcomes: discuss the theory of control chart, construct various control chart, determine the x-bar and r chart control limits. Six sigma management: a quality improvement system. The theory of control charts: both tqm and six sigma management use the control chart to analyze process data collected sequentially over time, the control chart monitors variation in a characteristic of a product or service over time. Upper control limit(ucl) = process mean + 3 standard deviation. Lower control limit(lcl) = process mean - 3 standard deviation. The control chart for the range (r chart) 2d factor = the relationship between the standard deviation and the range for varying sample sizes. 3d factor = the relationship between the standard deviation and the standard error of the range for varying sample sizes. X ix = sample mean of n observations at time i ir = range of n observations at time i k = number of subgroups.