SSH 301 Lecture Notes - Lecture 2: Mortality Rate, Interval Ratio, Frequency Distribution

15 Jul 2016
School
Department
Course
Professor
Document Summary
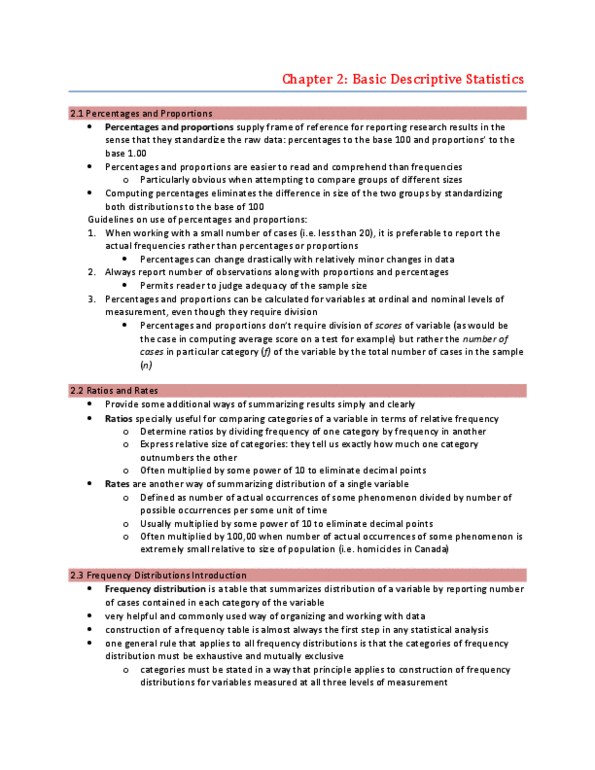
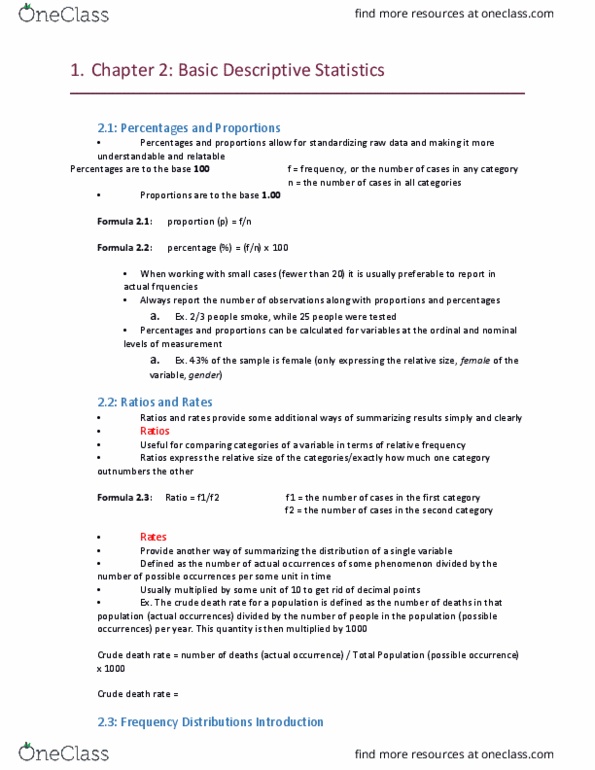
Percentages and proportions supply a frame of reference for reporting research results in the sense that they standardize raw data. Percentages to the base 100: formula percentage (%) = (insert symbol (page 33)) Proportions to the base 1. 00: formula proportion (p) = (insert symbol page 33) f = frequency, or the number of cases in any category n = number of cases in all categories. Percentages and proportions are easier to read and comprehend than frequencies. Computing percentages eliminates the difference in size of the two groups: standardizing both distributions to the base of 100. Working with small number of cases (less than 20), preferable to report frequencies, not percent or proportions. Always report # of observations, proportions and percentages: permits reader to judge adequacy of sample size, and prevents researcher from lying with statistics. Be suspicious of reports that fail to state the number of cases that were tested.