BUS 336 Lecture 4: Regression-336

11 Oct 2017
School
Department
Course
Professor
Document Summary
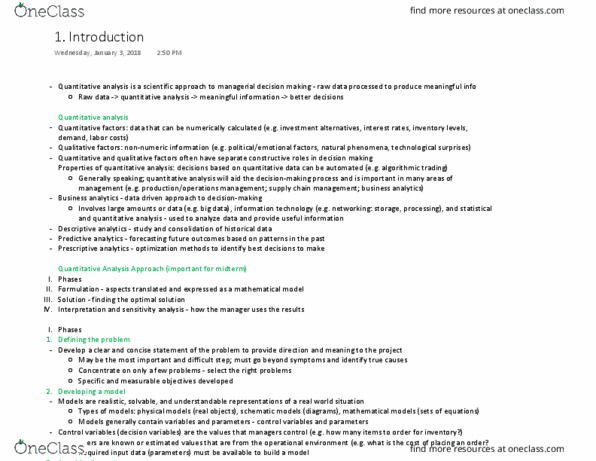
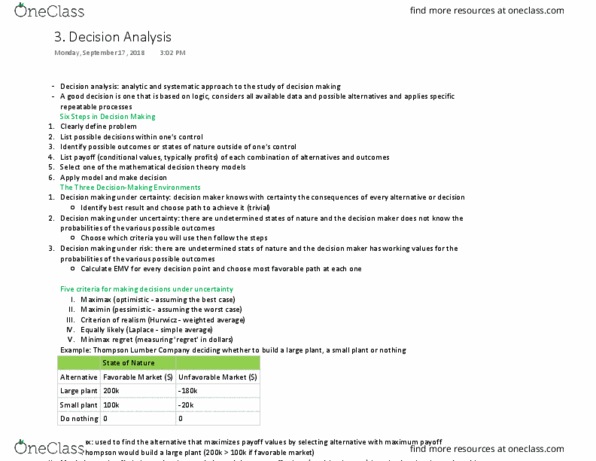
Quantitative analysis for management, twelfth edition, by render, stair, hanna and hale. After completing this chapter, students will be able to: Identify variables and use them in a regression model. 1: develop simple linear regression equations from sample data and interpret the slope and intercept, compute the coefficient of determination and the coefficient of correlation and interpret their meanings. Interpret the f test in a linear regression model. 4: list the assumptions used in regression and use residual plots to identify problems. Introduction: regression analysis very valuable tool for a manager. Predict the value of one variable based on another variable: simple linear regression models have only two variables, multiple regression models have more than one independent variable. Introduction: variable to be predicted is called the dependent variable or response variable. Value depends on the value of the independent variable(s) Scatter diagram: scatter diagram or scatter plot often used to investigate the relationship between variables.