BUEC 232 Lecture Notes - Lecture 6: Interquartile Range, Time Series, Standard Score

24 Sep 2018
School
Department
Course
Professor


16
BUEC 232 Full Course Notes
Verified Note
16 documents
Document Summary
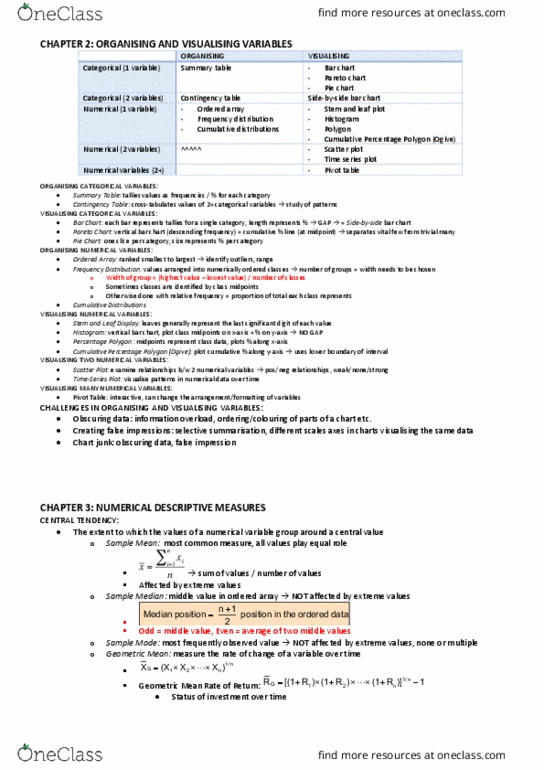
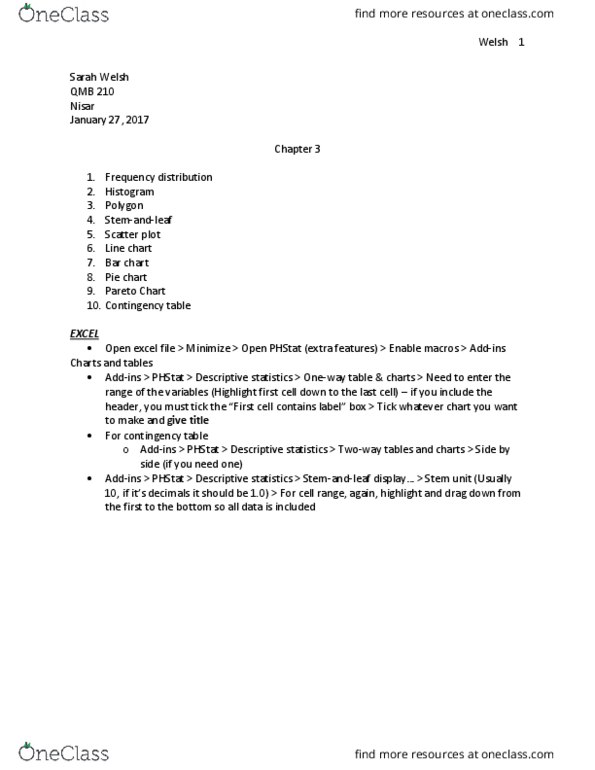
Total days (%) with temperature higher than 5 c : provide information as a fixed-bin histogram, do not have the precise info of individual data points, keep both digits, retain more information, for selected purpose. Conclusion & mini review: pivot tables in excel. For assignment 2, you will need to work with pivot tables. I will switch over to excel now to show you how. Tables graphs (cid:894)or (cid:862)charts(cid:863) or (cid:862)diagrams(cid:863)(cid:895) Techniques reviewed in this chapter: bar charts, pie charts, and pareto diagrams, ordered array and stem-and-leaf diagrams, frequency distributions, histograms and polygons, cumulative distributions and ogives, contingency (cid:894)or (cid:862)pivot(cid:863)(cid:895) tables, scatter diagrams and time series plots. The best data visualization you have ever seen: video, mini review, please introduce yourself to another student and sit in pairs for the mini-review, mini review. 24, 17, 38, 53, 45, 28, 24, 35: mini review.