BIOL208 Lecture Notes - Igloo, Microclimate, Antarctica

9 Apr 2014
School
Department
Course
Professor
Document Summary
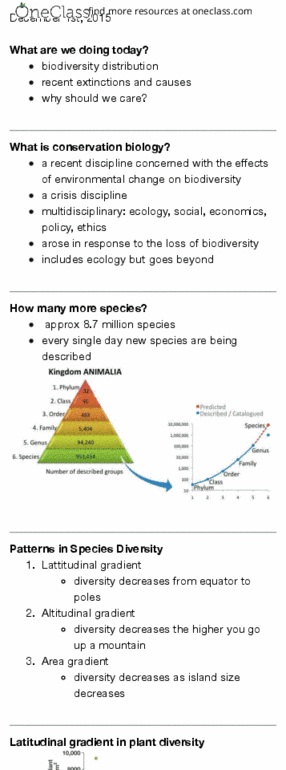
Biol 208 (january 15, 2014: ecologists use logarithmic graphs all the time. *extinction debt: we are in a period of massive species loss. *we are predicting extinction through species area curve. *as you move from poles to equator, you find higher diversity in species (for all organisms) *marine and terrestrial taxa demonstrate a more larger latitudinal gradient than freshwater: *means that diversity increases relating to marine and terrestrial organisms are greater with closer proximity to the equator than terrestrial organisms. *carnivores exhibit greatest latitudinal gradient: larger organisms in general tend to show a larger latitudinal gradient than smaller organisms. *the map that we generally look at is the mercator version. 3d to 2d conversion causes us to interpret the northern and southern extremes to be more larger in land area than they really are: *the peters version is the more realistic version.