Homework 5.1 p. 375 # 24
Give the equation(s) for the function(s) that bound the region and sketch the region.
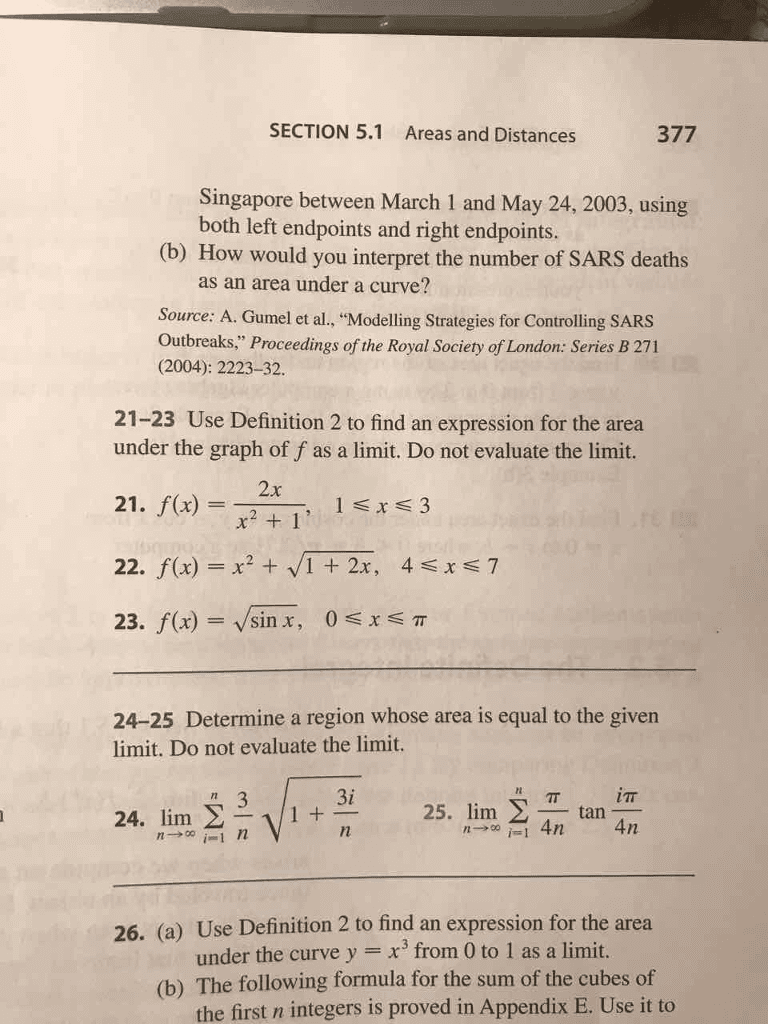
SECTION 5.1 Areas and Distances 377 Singapore between March 1 and May 24, 2003, using both left endpoints and right endpoints (b) How would you interpret the number of SARS deaths as an area under a curve? Source: A. Gumel et al., "Modelling Strategies for Controlling SARS Outbreaks," Proceedings of the Royal Society of London: Series B 271 (2004): 2223-32. 21-23 Use Definition 2 to find an expression for the area under the graph of f as a limit. Do not evaluate the limit. 2.x x21 24-25 Determine a region whose area is equal to the given limit. Do not evaluate the limit. 3i 25. line Σ_tan 26. (a) Use Definition 2 to find an expression for the area under the curve y x3from 0 to 1 as a limit. (b) The following formula for the sum of the cubes of the first n integers is proved in Appendix E. Use it to