STAT151 Lecture 3: #3 Chapters 7 - 10.pdf

4 Dec 2014
School
Department
Course
Professor

4
STAT151 Full Course Notes
Verified Note
4 documents
Document Summary
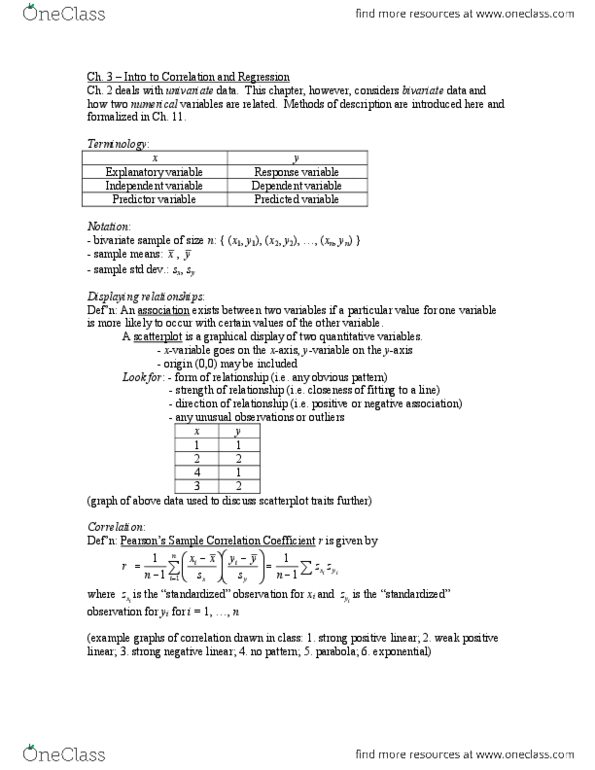
Chapters 7 10: exploring relationship between variables - In these chapters, we will quickly talk about. Definition: a scatter-plot is a graphical display for two quantitative variables. It uses the horizontal axis for the explanatory variable x and the vertical axis for the response y. The values of x and y for a subject are represented by a point relative to the two axes. The observations for the nsubjects are npoints on the scatter-plot. Example 1: find the scatter-plot of the following data. Definition: two quantitative variables are said to have a positive association when high value of x tend to occur with high value of y, and when low values of x tend to occur with low values of y. Title: performances in the men"s high jump from 1960 to. Definition: the sample correlation coefficient is defined by r. 1 n x x s x y s y y n z z x.