GEOG 1200 Lecture Notes - Lecture 9: Cartogram, Contour Line, Lightning

4 May 2017
School
Department
Course
Professor
Document Summary
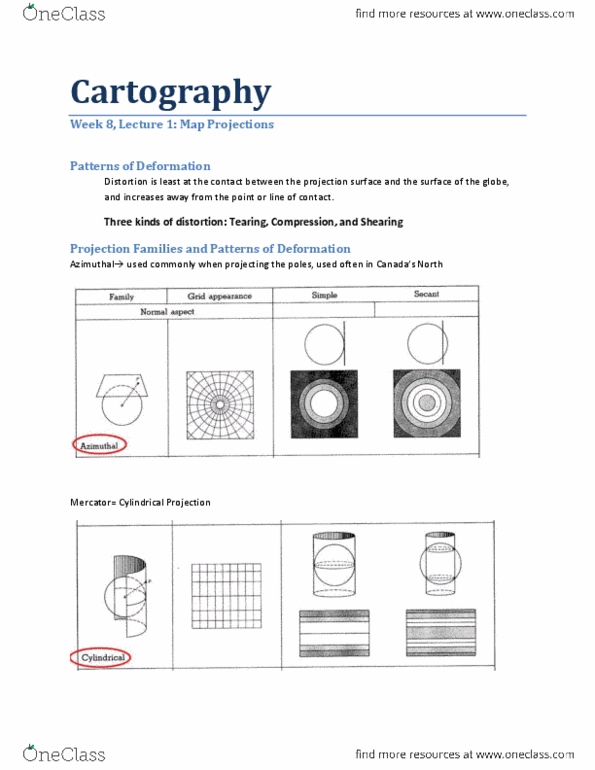
In the past, maps were used as a form of describing location (natural resources, cultural groups) Today we use maps for analysis, explanation, prediction. Equal-area projection: shows proper sizes of countries relative to others. Shape or outline of a country have been distorted. Both shape and direction are undistorted. (ex: mercator. Select one central point (guelph per se), distance is correct within this map. Azimuthal: good for navigation (north, east, south, west). Good when looking at areas covered by water. Topographic map- populated place, main purpose is to show natural features, contours, various landforms, any kind of permanent feature. Can show diffusion (how phenomenon spreads: isopleth map: shows intensities of occurrence using isolines (like contours) which connect data points of equal value. Often used to show weather patterns: proportional symbol map: this map works best when you want to show how often an event takes place.