PSYC 2360 Lecture Notes - Lecture 7: Multiple Correlation

31 Mar 2016
School
Department
Course
Professor
Document Summary
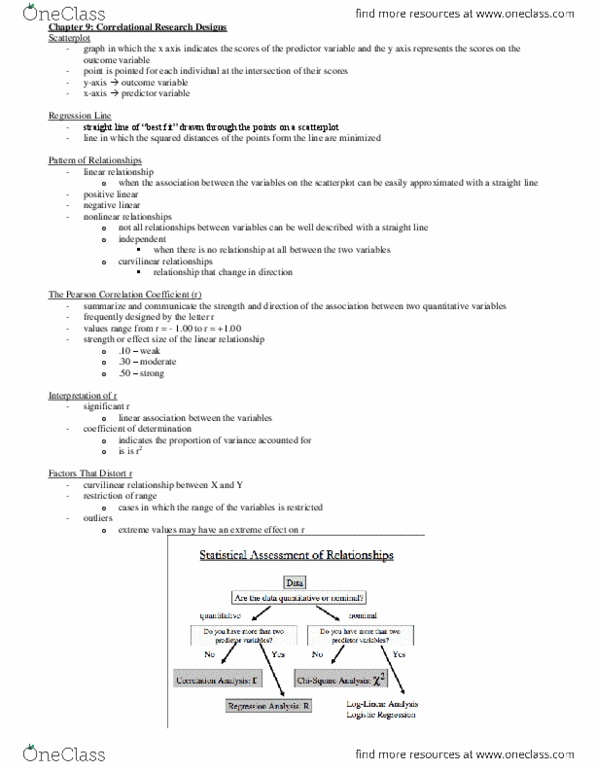
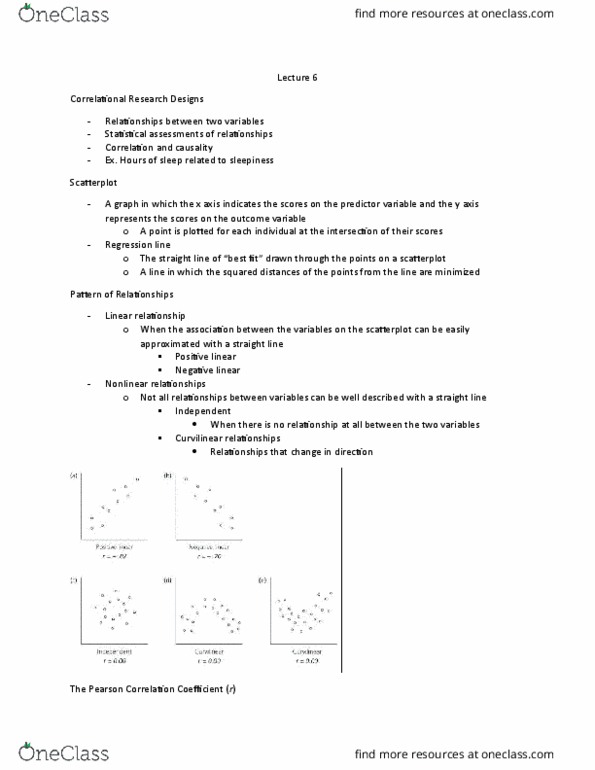
Is a negative or downward correlation o: + is a positive or upward correlation. Scatterplots used to chart correlations: x-axis: the scores on the predictor variable, y-axis: o. Line of best it a line that approximates the correlation, distances between data is squared/estimated and the line is in the middle and minimized the diferences. Linear relationship assuming that the lobf is a straight line o: nonlinear relationships. Curvilinear relationship cannot be approximated because of the need for a curved line, can"t use a straight one. Pearson correlational coeicient (r) goes from -1 +1: the strength or efect size of the linear relationship, ~. 10 : weak, ~. 30 : moderate, +. 50 : strong. Coeicient of determination (r2 : the % of variance that is explained by the two variables o r = . 50 r2 = 25% o. In cases in which there is a curvilinear relationship between x and y you"ll get coeicient of 0 because a straight line cannot be used.