STAT 2040 Lecture 7: unit 07

27 Feb 2018
School
Department
Course
Professor
Document Summary
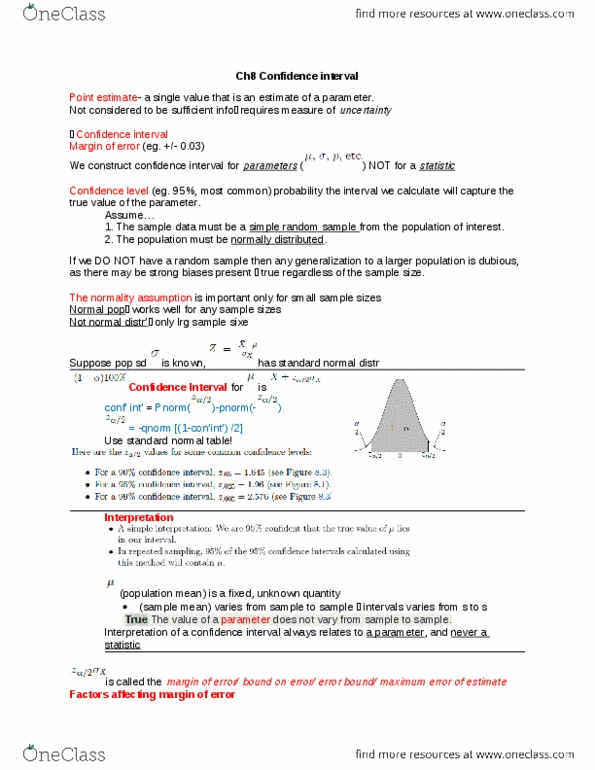
If the population is normal, then these methods will work for any sample size. It is the sample size that matters: the confidence level, all other factors being equal, the greater the confidence level, the greater, 8. 2. 3: examples the margin of error. In a normal quantile-quantile plot, the data points are plotted in such a way that if the sample if approximately normally distributed, the points will form (roughly) a straight line. If we do not have a random sample then any generalization to a larger population is dubious. It is rare that the assumptions are perfectly true, so procedures that work well in a variety of situations are most useful: but the procedures start to break down in the presence of outliers or strong skewness. If n>40 the t procedures perform well in most practical situations. If the sample size is greater than 40 we are in good shape in most commonly encountered situations.