PSYC 2260 Lecture Notes - Lecture 3: Central Tendency

16 Jan 2018
School
Department
Course
Professor
Document Summary
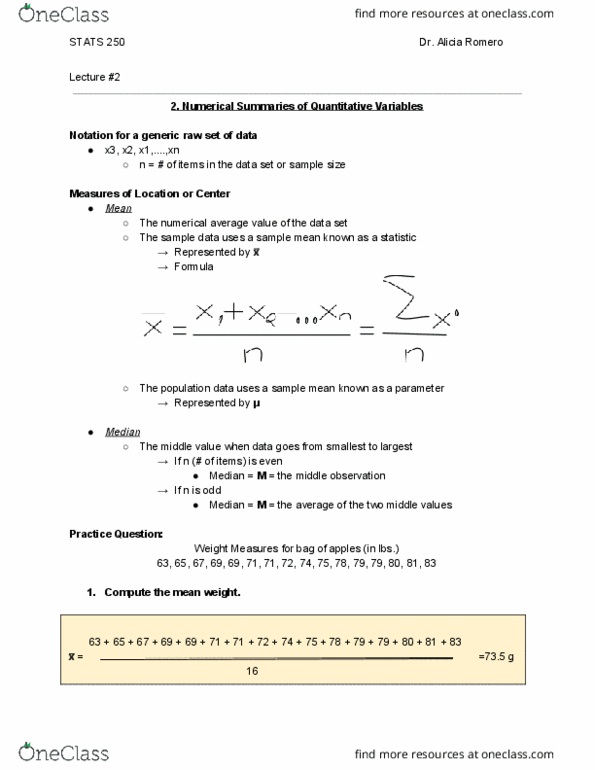
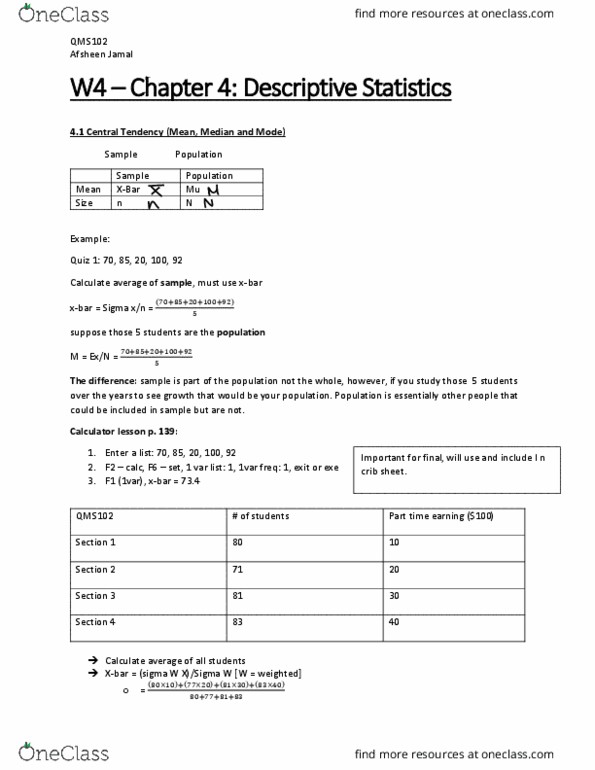
Lecture 3: organizing data (cnt: mean: the average value of a sample. To calculate, you total up the values and divide by the numbers of value/ sample size (n) Depending on the dataset, mean and median may be similar e. g, Mean affected by every single value in a sample while median is not. Median is more resistant to extreme values e. g, adding 2 more values to above dataset: Mean= 53. 9 median= 65 if there are extreme values in the sample, the median may be more reliable indicator of central tendency than mean the more values in a sample, the less influence these extreme values will be. For larger n, mean and median usually very similar. Calculating overall mean across group first need to know: mean and n of each group. Overall mean= weighted mean= (cid:2872)(cid:4666)(cid:2870)(cid:2868)(cid:4667) + (cid:2869)(cid:2874)(cid:4666)(cid:2869)(cid:2868)(cid:4667) The average grade for 3 sections in stat 2000 class: (cid:2870)(cid:2868) Overall mean= (71 + 62 + 77)/100 = 70.