COMM 207 Lecture Notes - Lecture 4: Null Hypothesis, Test Statistic, Sampling Distribution

Document Summary
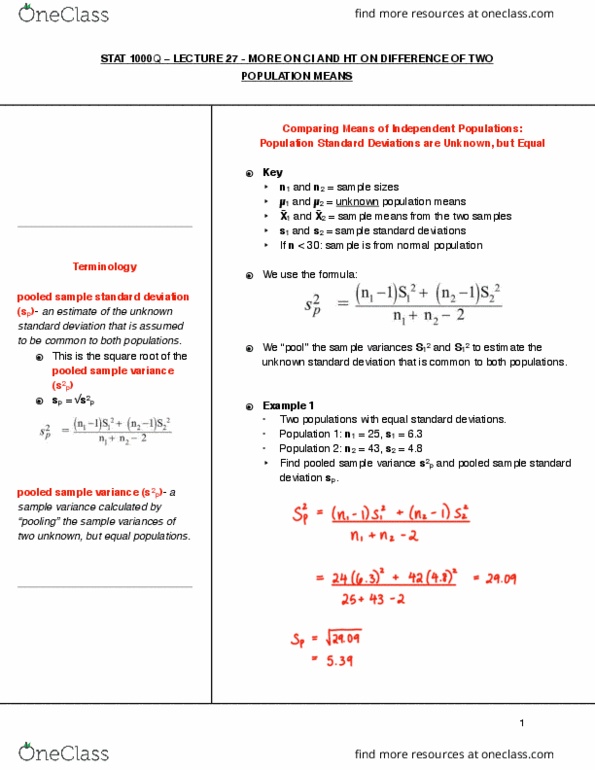
Chapter 8 comparing population means and variances using t tests and f ratios. 8. 1 t-tests about a population mean (variances unknown) Comparing two population means by using independent samples: variances unknown. Comparing two population variances by using independent samples. Defining the t statistic ( unknown): let x-bar be the mean of a sample of size n with standard deviation s, also, 0 is the claimed value of the population mean t. 0 n x s: define a new test statistic, the sampling distribution of the t statistic is a t distribution with n 1 degrees of freedom. If the population being sampled is normal, and. 3. 1589: since t = 3. 1589 < t. 01 = 2. 624, we reject h0: = 1. 5 in favour of ha: < 3. 1589: our observed t value is off the t table, so using the table, we would say that our p- value < 0. 0005, a statistical software package can easily calculate the exact p-value.